Simple PowerPoint Charts PPT Template Presentation

Colorful pie chart in PowerPoint slide showing 60, 30, and 10 percent segments with text boxes on a white backdrop.
P.ID : 46255
    354 views
    58 Downloads
    Get Custom Slides by Experts
    Instantly Access Templates in PowerPoint

    Best PowerPoint Charts For PPT Presentations 

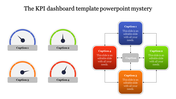
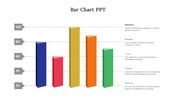
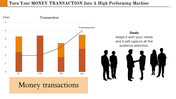
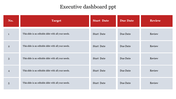
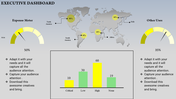
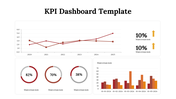
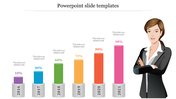
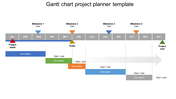
    Make some amusing pie charts in your powerpoint presentation slides using these powerpoint charts for ppt presentations. These charts will play a similar role to the standard pie charts  powerpoint presentation slides. This type of powerpoint presentation template can be effective when you want to present your ppt presentations as charts.

    This type of powerpoint presentation template is highly customizable and easily editable, and so they will save your most valuable time and resources to a considerable amount. So download these powerpoint charts for some most exciting and amusing powerpoint presentation charts.

    Features of this template:

    • 100% customizable slides and easy to download. 
    • Slides available in different nodes and colors. 
    • The slide contained 16:9 and 4:3 format.
    • Easy to change the slide colors quickly. 
    • It is a well-crafted template with an instant download facility. 
    • Saves time.
    • Easy accessible and user-friendly.
    Advertisement

    You May Also Like These PowerPoint Templates

    Add to Wishlist
    Download
    AI Customize
    KPI Dashboard PowerPoint And Google Slides Template
    Add to Wishlist
    Download
    AI Customize
    Data Analysis PowerPoint Templates and Google Slides
    Add to Wishlist
    Download
    AI Customize
    Creative Dashboard PowerPoint And Google Slides Template
    Free
    Add to Wishlist
    Download
    AI Customize
    Dashboard with four sections showing charts, icons, and metrics in purple, red, green, and teal.
    Free
    Add to Wishlist
    Download
    AI Customize
    Informative KPI Dashboard Template Download Slide PPT
    Add to Wishlist
    Download
    AI Customize
    KPI dashboard slide displaying supplier metrics with colorful pie charts, bar graphs, and a process flow with percentages.
    Free
    Add to Wishlist
    Download
    AI Customize
    Project plan Gantt chart template with timeline, color coded tasks descriptions, and milestones spanning from 2017 to 2019.
    Free
    Add to Wishlist
    Download
    AI Customize
    KPI Dashboard Template PPT Presentation and Google Slides
    Free
    Add to Wishlist
    Download
    AI Customize
    Gantt Chart PowerPoint Templates and Google Slides Themes
    Free
    Add to Wishlist
    Download
    AI Customize
    Slide with multiple dashboard elements including bar charts, line charts, pie charts, and progress meters in various colors.
    Free
    Add to Wishlist
    Download
    AI Customize
    KPI PowerPoint slide with line, bar, pie, and horizontal bar charts, each showing different business data metrics.
    Free
    Add to Wishlist
    Download
    AI Customize
    Multi-color pie chart slide deck showing data segments in various shades, each section labelled for visual comparison.
    Free
    Add to Wishlist
    Download
    AI Customize
    Business growth chart with a bar graph for years 2018 to 2022, captions on the left, and a text block at the bottom.
    Free
    Add to Wishlist
    Download
    AI Customize
    Free Dashboard Templates For PowerPoint & Google Slides
    Add to Wishlist
    Download
    AI Customize
    Brand perception map illustrating consumer views on six brand tastes and natural qualities, with color coded labels.
    Add to Wishlist
    Download
    AI Customize
    A color-coded pie chart illustrating four data segments with values 15%, 20%, 30%, and 35%, paired with text captions.