Editable PowerPoint Chart Templates Presentation

Green circular chart with five segments labeled by categories and percentages, with descriptions around it.
P.ID : 5576
    581 views
    55 Downloads
    Get Custom Slides by Experts
    Instantly Access Templates in PowerPoint

    Editable Pie Chart Templates Presentation

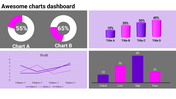
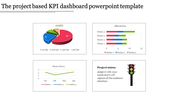
    Who doesn't love pie? And who doesn't love charts? This slide is sure to distract your slides from their boring business PPTs. With a minimalist violet theme, this slide will keep your audience engaged. When it comes to precise business PPTs that need a little flare, Piechart's theme is perfect for creating a compact data display. Our Editable PowerPoint Chart Templates Presentation is handy for presenting your business data. It is built with three pie chart graphics. Presentations that use pie charts are more effective at communicating the difference between numbers, plus they're better for understanding.


    Features of the template

    • 100% customizable slides and easy to download.
    • Slides are available in different nodes & colors.
    • The slide contained 16:9 and 4:3 formats.
    • Easy to change the slide colors quickly.
    • Well-crafted template with instant download facility.
    Advertisement

    You May Also Like These PowerPoint Templates

    Add to Wishlist
    Download
    AI Customize
    Five Node High Quality PowerPoint Presentations
    Add to Wishlist
    Download
    AI Customize
    KPI Dashboard PowerPoint And Google Slides Template
    Add to Wishlist
    Download
    AI Customize
    Data Analysis PowerPoint Templates and Google Slides
    Add to Wishlist
    Download
    AI Customize
    Creative Dashboard PowerPoint And Google Slides Template
    Free
    Add to Wishlist
    Download
    AI Customize
    Dashboard with four sections showing charts, icons, and metrics in purple, red, green, and teal.
    Free
    Add to Wishlist
    Download
    AI Customize
    Project plan Gantt chart template with timeline, color coded tasks descriptions, and milestones spanning from 2017 to 2019.
    Free
    Add to Wishlist
    Download
    AI Customize
    Gantt Chart PowerPoint Templates and Google Slides Themes
    Free
    Add to Wishlist
    Download
    AI Customize
    Multi-color pie chart slide deck showing data segments in various shades, each section labelled for visual comparison.
    Free
    Add to Wishlist
    Download
    AI Customize
    Business growth chart with a bar graph for years 2018 to 2022, captions on the left, and a text block at the bottom.
    Add to Wishlist
    Download
    AI Customize
    Brand perception map illustrating consumer views on six brand tastes and natural qualities, with color coded labels.
    Add to Wishlist
    Download
    AI Customize
    A color-coded pie chart illustrating four data segments with values 15%, 20%, 30%, and 35%, paired with text captions.
    Add to Wishlist
    Download
    AI Customize
    Three-section KWL chart with bold headings in orange, pink, and purple columns, each containing placeholder text.
    Add to Wishlist
    Download
    AI Customize
    Butterfly chart with mirrored orange bars on either side, aligned symmetrically, and reducing in size towards the center.
    Add to Wishlist
    Download
    AI Customize
    Smart chart template slide showing bar and line charts labeled net profit alongside numbered caption area.
    Add to Wishlist
    Download
    AI Customize
    A bubble chart slide with four quadrants featuring colorful icons for key business strategies with a placeholder text area.
    Add to Wishlist
    Download
    AI Customize
    SmartArt pie chart showing 65% in red and 35% in green as a and b, with placeholder captions and a text box.
    Add to Wishlist
    Download
    AI Customize
    Radar PowerPoint Presentation Templates and Google Slides