Four Node PowerPoint Chart Template And Google Slides

Slide with a multiseries bar chart on the right and a darkened background on the left displaying text and a button.
P.ID : 35207
    208 views
    16 Downloads
    Get Custom Slides by Experts
    Instantly Access Templates in PowerPoint

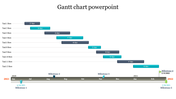
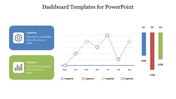
    PowerPoint Chart Template Presentation


    Struggling to turn complex data into digestible stories? This PowerPoint chart template is the answer to your prayers.

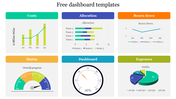
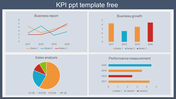
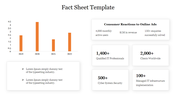
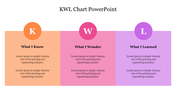
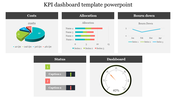
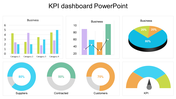
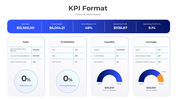
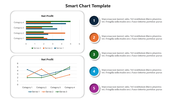
    Say goodbye to boring bar graphs and pie charts. This template features a modern design with four colorful charts that can be easily customized to represent your specific data. Each chart uses a distinct color scheme to make it easy for your audience to follow along and understand the key takeaways.

    Whether you're a business professional, educator, or nonprofit leader, this template is a powerful tool to visually communicate your ideas and leave a lasting impression.

    Let your data do the talking! Download the four-chart PowerPoint template today and transform your presentations.

    Features of the template


    • 100% customizable slides and easy to download.
    • The slides contain 16:9 and 4:3 formats.
    • Easy to change the colors quickly.
    • It is a well-crafted template with an instant download facility.
    • It is a 100% pre-designed slide.
    • The slide holds vibrant colors.
    Advertisement

    You May Also Like These PowerPoint Templates

    Add to Wishlist
    Download
    AI Customize
    Pentagon-shaped spider chart displaying two datasets in red and blue with two numbered caption areas.
    Add to Wishlist
    Download
    AI Customize
    Slide featuring a blue umbrella graphic with three labeled sections and two text boxes on the right.
    Free
    Add to Wishlist
    Download
    AI Customize
    Four vertical bar charts in orange, blue, red, and green on a white background, each with captions below.
    Add to Wishlist
    Download
    AI Customize
    Colorful pie chart with four segments in blue, purple, red, and orange, with matching text boxes showing percentages.
    Add to Wishlist
    Download
    AI Customize
    Metrics Dashboard PowerPoint Template & Google Slides
    Add to Wishlist
    Download
    AI Customize
    Slide with colorful bar and line graph, alongside a pie chart, featuring red, teal, blue, and purple elements on white.
    Add to Wishlist
    Download
    AI Customize
    Blank chart slide with a weekly layout from monday to sunday, featuring a grid for scheduling or organizing tasks.
    Free
    Add to Wishlist
    Download
    AI Customize
    Hexagonal radar chart showing five colorful sales metrics at the edges, alongside three numbered captions listed to the left.
    Add to Wishlist
    Download
    AI Customize
    Hoshin Kanri slide with a blue grid design labeled sections for annual objectives and a compass icon at the bottom.
    Add to Wishlist
    Download
    AI Customize
    Bar graph on a slide showing data from 2016 to 2019, with a title about statistics and a caption area section.
    Add to Wishlist
    Download
    AI Customize
    Stacked Bar Chart PowerPoint Template Presentation
    Add to Wishlist
    Download
    AI Customize
    Editable Dot Charts PowerPoint Template For Presentation
    Add to Wishlist
    Download
    AI Customize
    Slide showcasing survey data with percentage figures in colored text boxes and icons with a comparative bar chart.
    Add to Wishlist
    Download
    AI Customize
    Hexagonal web chart with blue and red lines showing financial data for six business areas at the corners.
    Free
    Add to Wishlist
    Download
    AI Customize
    Real estate KPI dashboard showing quarterly data in a green colored pie chart and bar graphs across various categories.
    Add to Wishlist
    Download
    AI Customize
    Change curve diagram mapping emotional responses over time, with stages from shock and denial along a wavy line.
    Add to Wishlist
    Download
    AI Customize
    Innovative Cockpit Charts PowerPoint Download PPT Slides