Free - PowerPoint Bar Chart Templates for Data Visualization
Free

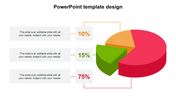

Free Bar Chart PowerPoint Templates
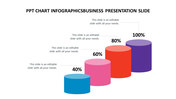
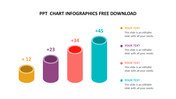
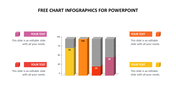
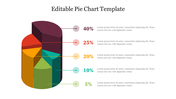
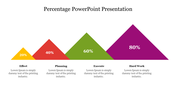
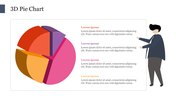
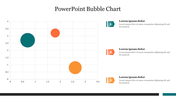
Embark on a journey of data visualization excellence with our free Bar Chart PowerPoint Templates and Google Slides Themes. This template features four 3D bars of varying sizes and percentage levels to empower presenters with dynamic visual storytelling tools. Each bar has an icon, a caption, and a text area to illustrate data trends, comparisons, and insights. Ideal for professionals across industries, from analysts to educators, this template streamlines the process of creating impactful presentations that resonate with audiences. Whether you're delivering financial reports, sales forecasts, or performance analyses, our template provides the flexibility and versatility to convey your message effectively. Elevate your data presentations today and captivate your audience with compelling visuals that leave a lasting impression.
Features of the template
- 100% customizable slides are easy to download.
- Slides are available in different colors.
- The slide has 4:3 and 16:9 formats.
- It is easy to change the slide colors quickly.
- It has a cute design to impress an audience.
- Create feature-rich, animated presentations.
- This slide is available in both PowerPoint and Google Slides.


You May Also Like These PowerPoint Templates
Add to Wishlist
Download
AI Customize

Add to Wishlist
Download
AI Customize

Add to Wishlist
Download
AI Customize


Add to Wishlist
Download
AI Customize

Add to Wishlist
Download
AI Customize

Add to Wishlist
Download
AI Customize

Add to Wishlist
Download
AI Customize

Add to Wishlist
Download
AI Customize

Add to Wishlist
Download
AI Customize

Add to Wishlist
Download
AI Customize

Add to Wishlist
Download
AI Customize

Add to Wishlist
Download
AI Customize

Add to Wishlist
Download
AI Customize

Add to Wishlist
Download
AI Customize

Add to Wishlist
Download
AI Customize


Add to Wishlist
Download
AI Customize

Free
Add to Wishlist
Download
AI Customize

Add to Wishlist
Download
AI Customize
