Best Positively Skewed Graph PowerPoint Template Slide

Graph showing a positively skewed distribution, with a longer tail extending to the right, indicating more high values.
P.ID : 59233
    131 views
    23 Downloads
    Get Custom Slides by Experts
    Instantly Access Templates in PowerPoint

    Skewed Graph Presentation Slide

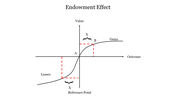
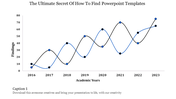
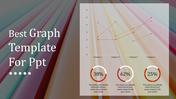
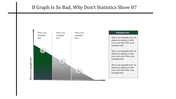
    A skewed graph is a type of graph where the distribution of data is not symmetrical and is typically characterized by a longer tail on one side of the graph. In the case of a positively skewed graph, the tail extends towards the higher values on the x-axis. This template provides a visual representation of a positively skewed graph, along with an explanation of how to interpret and analyze the data. It's a useful tool for anyone working with data analysis, statistics, or research.

    Features of the Template

    • 100% customizable slides and easy to download.
    • The slide contains 16:9 and 4:3 formats. 
    • Slides are available in different nodes & colors.
    • Easy to change the colors of the slide quickly.
    • Well-crafted template with an instant download facility.
    • It can be used for both PowerPoint & Google Slide
    Advertisement

    You May Also Like These PowerPoint Templates

    Add to Wishlist
    Download
    AI Customize
    Unique Chart Presentation For Your Creative Presentation
    Free
    Add to Wishlist
    Download
    AI Customize
    Bar Chart PowerPoint Templates and Google Slides Themes
    Free
    Add to Wishlist
    Download
    AI Customize
    PPT Charts and Graphs Template Presentation & Google Slides
    Free
    Add to Wishlist
    Download
    AI Customize
    Elegant PowerPoint Charts and Graphs Template and Google Slides
    Free
    Add to Wishlist
    Download
    AI Customize
    We have the Best Collection of Chart Presentation Slides
    Add to Wishlist
    Download
    AI Customize
    Slide showing a graph of the Dunning-Kruger Effect with stages from knowing nothing to becoming an expert with a title text.
    Add to Wishlist
    Download
    AI Customize
    Narrative arc slide displaying key plot stages with placeholder text areas.
    Add to Wishlist
    Download
    AI Customize
    Line graph slide with two data series in red and yellow, showing item based data fluctuations and a text caption.
    Add to Wishlist
    Download
    AI Customize
    Graph showing an upward curve with captions along key points, indicating growth or improvement over time.
    Add to Wishlist
    Download
    AI Customize
    Curve Graph PPT Template & Google Slides for Presentation
    Add to Wishlist
    Download
    AI Customize
    A collection of story arc slides featuring graphs illustrating rising action, climax, and resolution points for storytelling.
    Add to Wishlist
    Download
    AI Customize
    An S shaped curve graph with three key points, illustrating growth or change over time with captions.
    Add to Wishlist
    Download
    AI Customize
    Best Positively Skewed Histogram Presentation Slide
    Add to Wishlist
    Download
    AI Customize
    A bell curve chart slide with an orange shaded area representing percentages for standard deviations.
    Add to Wishlist
    Download
    AI Customize
    A four quadrant graph with colorful sections labeled from 01 to 04 in the center. Each quadrant has placeholder text area.
    Add to Wishlist
    Download
    AI Customize
    Graph representation of the Dunning Kruger effect, mapping confidence levels from know nothing to expert across four stages.
    Add to Wishlist
    Download
    AI Customize
    Editable Kano Model PowerPoint and Google Slides Themes