Pie Chart PPT Template and Google Slides Themes


Pie Chart PPT Template and Google Slides Themes
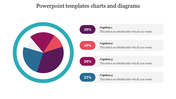
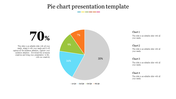
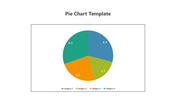
The Pie Chart PowerPoint template and Google Slides theme provide an effective visual tool for illustrating the allocation of expenses and resources within your company. With segmented sections representing different expenditure categories, presenters can showcase the distribution of funds with clarity and precision.
Each segment of the pie chart is accompanied by a percentage, allowing viewers to understand the relative proportion of expenses or resources attributed to each category. The colors used in the chart enhance visual appeal and aid in distinguishing between different segments at a glance.
Utilizing this template enables presenters to streamline the communication of financial data, budget allocations, or resource distribution strategies to stakeholders, team members, or clients.
Whether used in financial reports, business presentations, or project meetings, the pie chart template facilitates clear and concise representation of complex information, fostering better understanding and decision-making.
Features of the template
- 100% customizable slides and easy to download.
- Slides are available in different nodes & colors.
- The slide contains 16:9 and 4:3 formats.
- It is easy to change the colors of the slide quickly.
- Well-crafted template with an instant download facility.


You May Also Like These PowerPoint Templates
Add to Wishlist
Download
AI Customize

Add to Wishlist
Download
AI Customize

Add to Wishlist
Download
AI Customize

Add to Wishlist
Download
AI Customize

Add to Wishlist
Download
AI Customize

Add to Wishlist
Download
AI Customize


Add to Wishlist
Download
AI Customize

Add to Wishlist
Download
AI Customize

Add to Wishlist
Download
AI Customize

Add to Wishlist
Download
AI Customize

Add to Wishlist
Download
AI Customize

Add to Wishlist
Download
AI Customize

Add to Wishlist
Download
AI Customize


Add to Wishlist
Download
AI Customize

Add to Wishlist
Download
AI Customize

Add to Wishlist
Download
AI Customize

Add to Wishlist
Download
AI Customize

Add to Wishlist
Download
AI Customize
