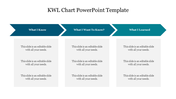
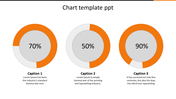
Effective Pie Chart Template Presentation-Four Node

Pie chart highlighting percentages for four steps with a caption areas in a circular layout placed in a grey backdrop.
P.ID : 13353
    371 views
    35 Downloads
    Get Custom Slides by Experts
    Instantly Access Templates in PowerPoint

    Give Detailed Explanation With This Template:


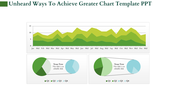
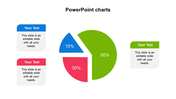
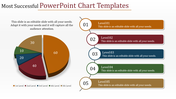
    A classy pie chart template gives a professional look to your presentation when you use it. The colorful pie chart can explain the statistical analysis of the organization or any in other sectors. You have a line connecting the pie chart and the node on the template, which relates to the percentage and the caption. 

    There are four small icons inserted near the nodes to add more information to your content. Also, the white background highlights the pie chart image and curiosity in the audience's minds. 

    Features of this Template: 

    • 100% customizable slides and easy to download.
    • Slides available in different nodes & colors.
    • The Slide contained 16:9 and 4:3 format.
    • Easy to change the slide colors quickly.
    • Well-crafted Template with instant download facility.
    • Grey background highlights the content.
    • Enchanting icons and colors are used.
    Advertisement

    You May Also Like These PowerPoint Templates

    Add to Wishlist
    Download
    AI Customize
    KPI dashboard with bar graphs showing data trends over time and two green summary boxes.
    Add to Wishlist
    Download
    AI Customize
    Vehicle dashboard slide featuring a speedometer on the left and a detailed table on the right with its brands.
    Free
    Add to Wishlist
    Download
    AI Customize
    A PPT chart template featuring a table layout with rows labeled Text and columns with bar charts in different shades of blue.
    Add to Wishlist
    Download
    AI Customize
    Slide with multiple charts including bar, line, and pie charts illustrating data for hires, turnover, and training.
    Free
    Add to Wishlist
    Download
    AI Customize
    Visual of project phases and value generation over time, with milestones labeled as planning, detailing, and implementation.
    Add to Wishlist
    Download
    AI Customize
    Bar chart slide design with stacked bars showing three categories per item and percentage captions on the left.
    Add to Wishlist
    Download
    AI Customize
    Business column chart template showing four bar sections, each representing industries with icons and data percentages.
    Add to Wishlist
    Download
    AI Customize
    Colorful bar chart slide for an annual report in PowerPoint, displaying monthly data from January to December.
    Add to Wishlist
    Download
    AI Customize
    Business slide with four sections representing different concepts Equality, Human Rights, Independent, and Multi Party.
    Add to Wishlist
    Download
    AI Customize
    Executive dashboard with a pie chart, vertical and horizontal bar graph, and a waterfall chart, displaying various data.
    Add to Wishlist
    Download
    AI Customize
    Colorful bar chart PPT template displaying four sections with data values and corresponding captions for 2018 to 2021.
    Add to Wishlist
    Download
    AI Customize
    Business dashboard featuring a profile card, three financial metrics, a 67% circular chart, and a dual-colored area graph.
    Add to Wishlist
    Download
    AI Customize
    Dashboard summary featuring progress visualizations, names, task status updates, and rewards marked with gold stars.
    Add to Wishlist
    Download
    AI Customize
    A colorful dashboard PowerPoint slide featuring graphs, stats, and a pie chart for a data driven presentation with captions.
    Add to Wishlist
    Download
    AI Customize
    Dashboard PowerPoint slide featuring three speedometer style gauges displaying percentages with a dartboard graphic.
    Add to Wishlist
    Download
    AI Customize
    Dashboard with charts and metrics, including pie chart for sales, bar and line charts, and visitor statistics.
    Free
    Add to Wishlist
    Download
    AI Customize
    Line chart with data points marked by blue squares and black dots, displaying values from 2006 to 2014.
    Add to Wishlist
    Download
    AI Customize
    Dashboard slide displaying upcoming deposits, transactions, market location, and financial data on a dark backdrop.
    Add to Wishlist
    Download
    AI Customize
    Executive dashboard PowerPoint slide featuring line and bar charts, pie charts, and world map markers for data analysis.