Download Pie Chart Presentation PowerPoint Slides Design


Drive Your Data Insights with Our Pie Chart Presentation Template
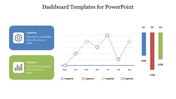
A pie chart is an essential tool for visualizing data proportions and making comparisons clear. Our Pie Chart PowerPoint Template and Google Slides Themes are designed to transform your data presentations with precision and impact. This multicolor template features a grey-themed circle divided into five sections, each representing a different car company with varying percentages. At the center, a car icon adds a cohesive visual element. Each section includes a caption text area for detailed explanations, making it ideal for market analysis, sales comparisons, or business reports. Customize each segment to reflect your specific data and insights, guiding your audience through your analysis with clarity and professionalism. Elevate your presentations and ensure your data tells a compelling story with this dynamic and visually engaging pie chart template.
Features of this template:
- 100 % customizable slides are easy to download.
- Slides are available in different nodes and colors.
- The slide was contained in 16:9 and 4:3 formats.
- It is easy to change the slide colors quickly.
- Well-crafted template with an instant download facility.
- The clear layout of this template will help you design a professional-looking presentation.
- The multi-color visuals on this slide will make your presentation eye-catching.


You May Also Like These PowerPoint Templates
Add to Wishlist
Download
AI Customize

Add to Wishlist
Download
AI Customize

Add to Wishlist
Download
AI Customize

Add to Wishlist
Download
AI Customize


Add to Wishlist
Download
AI Customize

Add to Wishlist
Download
AI Customize

Add to Wishlist
Download
AI Customize

Add to Wishlist
Download
AI Customize

Add to Wishlist
Download
AI Customize

Add to Wishlist
Download
AI Customize

Add to Wishlist
Download
AI Customize


Add to Wishlist
Download
AI Customize

Add to Wishlist
Download
AI Customize

Add to Wishlist
Download
AI Customize

Add to Wishlist
Download
AI Customize

Add to Wishlist
Download
AI Customize

Add to Wishlist
Download
AI Customize

Add to Wishlist
Download
AI Customize
