Impress your Audience with Pie Chart Presentation Slides

Purple pie chart with five labeled sections representing sales for various car brands, featuring a car image at the center.
P.ID : 28118
    99 views
    2 Downloads
    Get Custom Slides by Experts
    Instantly Access Templates in PowerPoint

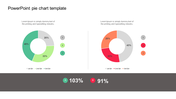
    Drive Success with Our Pie Chart Presentation Template


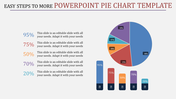
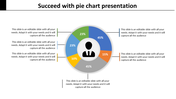
    This Pie Chart Presentation template has a purple-colored, circular pie chart with an image of a car in the center, where car sales data have been projected. On the circle, five divisions are given with percentages accordingly signifying different companies dealing with cars. Towards the right five text areas are provided. These can easily be edited as company names and sales figures are written below them. Hence data is easy to customize.

    Who can use this?

    Ideal for market analysts, sales teams, and care professionals, this template facilitates the presentation of complex sales data in clear and engaging forms.

    Can this template also be used for other types of presentations?

    While it is designed for car sales data, the versatility of this template makes it perfectly suitable for various types of sales and market data presentations.

    What is a pie chart?

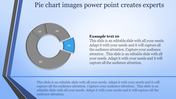
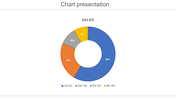
    A pie chart is a circular graphic where each section (slice) represents a portion of the total data, visualized proportionally.

    Download now and change the way you do business presentations at your workplace.

    Features of the template


    • 100% customizable slides and easy to download.
    • The slides contain 16:9 and 4:3 formats.
    • Easy to change the colors quickly.
    • It is a well-crafted template with an instant download facility.
    • It is a 100% pre-designed slide.
    • The slide holds vibrant colors.
    Advertisement

    You May Also Like These PowerPoint Templates

    Free
    Add to Wishlist
    Download
    AI Customize
    Five Node New Business Presentation Template
    Free
    Add to Wishlist
    Download
    AI Customize
    Annual Report PPT Presentation With Background Design
    Free
    Add to Wishlist
    Download
    AI Customize
    Engaging Pie Chart Template for Presentation - Cloud Model
    Add to Wishlist
    Download
    AI Customize
    Progress chart slide showing four colorful circular charts labeled from business to report with varying percentages and text.
    Add to Wishlist
    Download
    AI Customize
    Amazing Pie Charts PowerPoint Presentation Template
    Add to Wishlist
    Download
    AI Customize
    Colorful pie chart slide showing five distinct stages with varying percentage values each with numbered placeholder text.
    Free
    Add to Wishlist
    Download
    AI Customize
    Predesigned Free Pie Graph Templates For Presentation
    Free
    Add to Wishlist
    Download
    AI Customize
    Smart pie chart with five segments in different colors, displaying percentages, with three placeholder text to the right.
    Free
    Add to Wishlist
    Download
    AI Customize
    Four circular progress graphs in blue, orange, red, and green, each showing percentages and captions.
    Add to Wishlist
    Download
    AI Customize
    Pointer Annual Report PowerPoint Template Presentation
    Add to Wishlist
    Download
    AI Customize
    Chart Maker for Google Slides and PowerPoint Template
    Free
    Add to Wishlist
    Download
    AI Customize
    Best Annual Report Presentation Template
    Free
    Add to Wishlist
    Download
    AI Customize
    Colorful pie chart slide showing five segments with percentages, paired with four content boxes for additional information.
    Add to Wishlist
    Download
    AI Customize
    70-20-10 Approach To Learning PowerPoint Template Design
    Free
    Add to Wishlist
    Download
    AI Customize
    Multi-color Pie Chart PPT Template and Google Slides
    Add to Wishlist
    Download
    AI Customize
    Attractive Custom Pie Chart PowerPoint Presentation
    Add to Wishlist
    Download
    AI Customize
    Three circular progress charts in red, teal, and yellow, with percentage levels, displayed on a black rectangular box.
    Add to Wishlist
    Download
    AI Customize
    Cute Pie Chart  Diagram PowerPoint Presentation Template