Imaginative Pie Chart PowerPoint And Google Slides

Five segment pie chart in orange, blue, red, green, and pink, each with number and connected with text areas.
P.ID : 16521
    763 views
    57 Downloads
    Get Custom Slides by Experts
    Instantly Access Templates in PowerPoint

    Creative Pie Chart PowerPoint Template


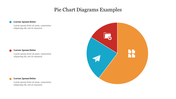
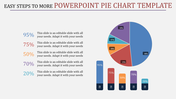
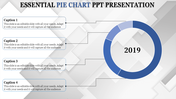
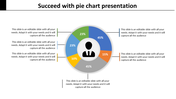
    Our Pie Chart PowerPoint template is meticulously designed to help you visually represent data distribution and proportions with clarity and precision. This template is perfect for presenting percentages, shares, and comparative data in an easily understandable format, making it an invaluable tool for analysts, researchers, educators, and business professionals. The pie chart format offers a simple yet effective way to showcase the composition of a whole, allowing your audience to quickly grasp key insights and trends.

    With customizable slides, you can tailor the charts to match your data's specifics and highlight the most important information. This template not only enhances the visual appeal of your presentations but also saves you time in creating professional and impactful charts. By utilizing this template, you can ensure that your data presentations are both informative and visually compelling. Make your data analysis stand out with our Pie Chart PowerPoint template. Download this template today!

    Features of this template


    • 100% customizable slides and easy to download.
    • The slide contains 16:9 and 4:3 formats.
    • Easy to change the colors of the slide quickly.
    • Highly compatible with PowerPoint and Google Slides.
    Advertisement

    You May Also Like These PowerPoint Templates

    Free
    Add to Wishlist
    Download
    AI Customize
    Innovative Management PowerPoint Template Presentation
    Free
    Add to Wishlist
    Download
    AI Customize
    Use Pie Chart PowerPoint Presentation Template
    Add to Wishlist
    Download
    AI Customize
    Cool Pie Charts PPT Presentation Template Slide
    Free
    Add to Wishlist
    Download
    AI Customize
    Five Node New Business Presentation Template
    Add to Wishlist
    Download
    AI Customize
    Multicolor Pie Chart PPT Template Presentation Designs
    Free
    Add to Wishlist
    Download
    AI Customize
    Best Business PowerPoint Slides for Professional Use
    Add to Wishlist
    Download
    AI Customize
    Circle Model Business Plan Template PowerPoint
    Free
    Add to Wishlist
    Download
    AI Customize
    Engaging Pie Chart Template for Presentation - Cloud Model
    Add to Wishlist
    Download
    AI Customize
    Progress chart slide showing four colorful circular charts labeled from business to report with varying percentages and text.
    Add to Wishlist
    Download
    AI Customize
    Amazing Pie Charts PowerPoint Presentation Template
    Add to Wishlist
    Download
    AI Customize
    Colorful pie chart slide showing five distinct stages with varying percentage values each with numbered placeholder text.
    Free
    Add to Wishlist
    Download
    AI Customize
    Predesigned Free Pie Graph Templates For Presentation
    Free
    Add to Wishlist
    Download
    AI Customize
    Smart pie chart with five segments in different colors, displaying percentages, with three placeholder text to the right.
    Free
    Add to Wishlist
    Download
    AI Customize
    Four circular progress graphs in blue, orange, red, and green, each showing percentages and captions.
    Add to Wishlist
    Download
    AI Customize
    Chart Maker for Google Slides and PowerPoint Template
    Free
    Add to Wishlist
    Download
    AI Customize
    Colorful pie chart slide showing five segments with percentages, paired with four content boxes for additional information.
    Free
    Add to Wishlist
    Download
    AI Customize
    Multi-color Pie Chart PPT Template and Google Slides
    Add to Wishlist
    Download
    AI Customize
    Attractive Custom Pie Chart PowerPoint Presentation
    Add to Wishlist
    Download
    AI Customize
    Three circular progress charts in red, teal, and yellow, with percentage levels, displayed on a black rectangular box.