Free Petal Diagram Template PowerPoint and Google Slides


Petal Diagram Presentation Slide
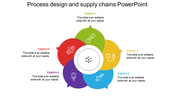
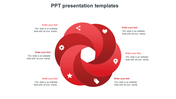
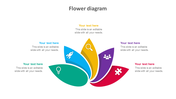
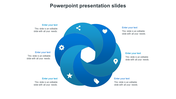
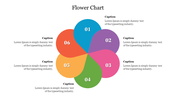
Petal Diagram is a circular diagram that is commonly used to represent intricate data elegantly and clearly. It is made up of overlapping petals, each of which represents a different aspect of the data being presented. You can utilize our slide to display the relationships between different data sets, compare data points, and identify patterns or trends. It is a useful tool for businesses and organizations looking to present data in a lucid and precise way. It can be customized to fit your specific needs and highlight key information in a fascinating and memorable way.
Features of the template
- 100% customizable slides and easy to download.
- Slides are available in different nodes & colors.
- The slide contains 16:9 and 4:3 formats.
- Easy to change the slide colors quickly.
- Well-crafted template with an instant download facility.
- Access on both MS PowerPoint and Google Slides.
- Six nodes are added.
- Flower-themed node setup.


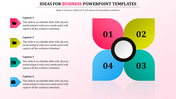
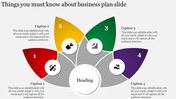
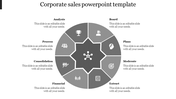
You May Also Like These PowerPoint Templates


Add to Wishlist
Download
AI Customize


Add to Wishlist
Download
AI Customize


Free
Add to Wishlist
Download
AI Customize

Add to Wishlist
Download
AI Customize

Add to Wishlist
Download
AI Customize


Add to Wishlist
Download
AI Customize


Add to Wishlist
Download
AI Customize

Free
Add to Wishlist
Download
AI Customize

Add to Wishlist
Download
AI Customize

Add to Wishlist
Download
AI Customize
