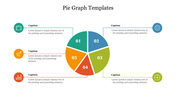
Best Microsoft PowerPoint Pie Chart Presentation Slide

Microsoft PowerPoint slide featuring three donut charts in yellow, orange, and pink, each with different percentage values.
P.ID : 65117
    204 views
    27 Downloads
    Get Custom Slides by Experts
    Instantly Access Templates in PowerPoint

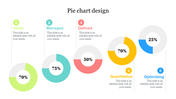
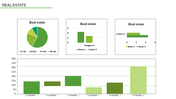
    Editable Demographic Representation Pie Chart

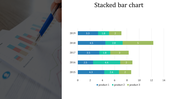
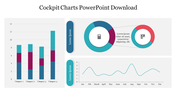
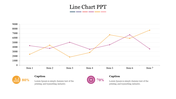
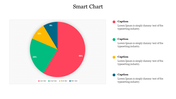
    Using Charts, you can easily represent the data, and also, you can convey the total amount in percentage values. The pie charts are used to show the quantity and also the counts brilliantly. Here you can also decide on the more prominent and least numbers instead of counting. This leads to a perfect representation of values.

    About the template

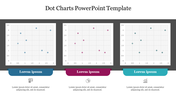
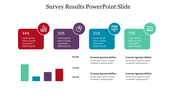
    Pie Charts are used to represent various data uniquely. This pictorial representation helps in analyzing or delivering data rigidly. Three rectangular boxes are added in that one side has the circles with percentage values. You can add your values to get the percentage values instantly; also, it is effectively shown in the diagrammatic representations. The colors are used to show the amount; from that, you can directly know the higher and lower values.

    Features of this template:

    • Innovative slide background designs
    • 100% easy to edit and customize slides
    • The slide contained 16:9 and 4:3 format.
    • Easy to change the slide colors quickly.
    • The elegant look of this template will give life to your process presentation.
    • Designs are more vivid.
    • You can Show data easily.
    Advertisement

    You May Also Like These PowerPoint Templates

    Add to Wishlist
    Download
    AI Customize
    Bar chart slide showing data trends from 2016 to 2021 with three categories, highlighted in red, teal, and yellow bars.
    Add to Wishlist
    Download
    AI Customize
    Progress Bar PPT Template PowerPoint Presentation Slides
    Free
    Add to Wishlist
    Download
    AI Customize
    Color-coded Gantt chart template for project management, displaying four phases across quarters with colorful text boxes.
    Add to Wishlist
    Download
    AI Customize
    Innovative KWL Chart Presentation Slide Template Design
    Add to Wishlist
    Download
    AI Customize
    KPI dashboard template with six sections which includes charts, graphs, and numerical data.
    Free
    Add to Wishlist
    Download
    AI Customize
    Four circular progress graphs in blue, orange, red, and green, each showing percentages and captions.
    Add to Wishlist
    Download
    AI Customize
    Pointer Annual Report PowerPoint Template Presentation
    Add to Wishlist
    Download
    AI Customize
    Chart Maker for Google Slides and PowerPoint Template
    Free
    Add to Wishlist
    Download
    AI Customize
    Best Annual Report Presentation Template
    Free
    Add to Wishlist
    Download
    AI Customize
    Colorful pie chart slide showing five segments with percentages, paired with four content boxes for additional information.
    Free
    Add to Wishlist
    Download
    AI Customize
    Multi-color Pie Chart PPT Template and Google Slides
    Add to Wishlist
    Download
    AI Customize
    Attractive Custom Pie Chart PowerPoint Presentation
    Add to Wishlist
    Download
    AI Customize
    Three circular progress charts in red, teal, and yellow, with percentage levels, displayed on a black rectangular box.
    Add to Wishlist
    Download
    AI Customize
    Cute Pie Chart  Diagram PowerPoint Presentation Template
    Add to Wishlist
    Download
    AI Customize
    Buy Highest Quality Predesigned Pie Chart PPT Slides
    Add to Wishlist
    Download
    AI Customize
    Best Sample Diagrams Charts For PPT Presentation