Alluring Matrix Presentation PPT And Google Slides

Risk matrix template with three blue 3D blocks labeled high, medium, and low, arranged vertically.
P.ID : 26484
    130 views
    1 Downloads
    Get Custom Slides by Experts
    Instantly Access Templates in PowerPoint

    Matrix Report Example Template


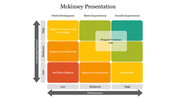
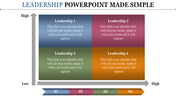
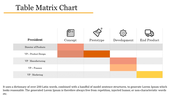
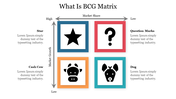
    Looking for a template to present the risk factors? Make use of our Matrix Presentation PPT And Google Slides Template. It helps to convey risk assessments. The slide has a dual-axis layout with both horizontal and vertical axes, to present data with clarity and precision. Three brightly colored horizontal bars help differentiate varying levels of impact and probability. Ideal for project managers, business analysts and risk management consultants. 

    It enhances presentations in boardrooms, client meetings and strategic planning sessions. The customizable captions provide space for detailed explanations. Apt for illustrating potential project risks, conducting SWOT analyses or explaining market opportunities. Download now to highlight your communication and decision-making processes. 

    Features of the template

    • The slide contains 16:9 and 4:3 formats.
    • Compatible with Google slide themes and PowerPoint.
    • 100% customizable slides and easy to download.
    • It is easy to change the colors of the slide quickly.
    • Well-crafted template with an instant download facility.
    Advertisement

    You May Also Like These PowerPoint Templates

    Add to Wishlist
    Download
    AI Customize
    Slide featuring four quadrants labeled by impact and difficulty, highlighting high and low impact with placeholder text.
    Add to Wishlist
    Download
    AI Customize
    Colorful Porter's Generic Strategies matrix slide outlining business strategies like cost leadership, and differentiation.
    Add to Wishlist
    Download
    AI Customize
    Chart visualizing alignments from good to evil and lawful to chaotic, with descriptive labels in each colored quadrant.
    Add to Wishlist
    Download
    AI Customize
    Moscow method slide showing four quadrants must have, should have, could have, and will not have, with placeholder text.
    Add to Wishlist
    Download
    AI Customize
    Slide with SCQA layout, featuring four blocks labeled S, C, Q, A in purple, red, yellow, and pink with icons and text.
    Add to Wishlist
    Download
    AI Customize
    Matrix slide with color-coded quadrants representing different approaches for product and market growth.
    Free
    Add to Wishlist
    Download
    AI Customize
    A horizontal competitive matrix with six rows of color-coded segments, featuring placeholders text and circle indicators.
    Add to Wishlist
    Download
    AI Customize
    Organizational chart depicting a matrix structure with roles like CEO, General Manager, and various department managers.
    Add to Wishlist
    Download
    AI Customize
    A slide showing the Eisenhower decision matrix, divided into four color coded sections representing tasks.
    Add to Wishlist
    Download
    AI Customize
    Best BCG Matrix PowerPoint Template and Google Slides
    Add to Wishlist
    Download
    AI Customize
    Four colored blocks in blue, red, purple, and orange in a square layout, with central white rectangle holding title.
    Add to Wishlist
    Download
    AI Customize
    Ansoff matrix slide with a 2x2 grid, showing strategies for existing and new products across existing and new markets.
    Free
    Add to Wishlist
    Download
    AI Customize
    A 9 box matrix with three rows for potential and columns for performance, with color coded categories.
    Free
    Add to Wishlist
    Download
    AI Customize
    Simple escalation matrix template with a grid layout and color markers in yellow, green, purple, and red with text captions.
    Add to Wishlist
    Download
    AI Customize
    Impact effort matrix slides categorizing tasks by effort and impact using quadrants and colorful labels.
    Add to Wishlist
    Download
    AI Customize
    Slide with a prioritization matrix chart plotting risk versus implementation complexity, using color coded circular markers.