Stunning Matrix Presentation PPT and Google Slides

 Canva
Canva


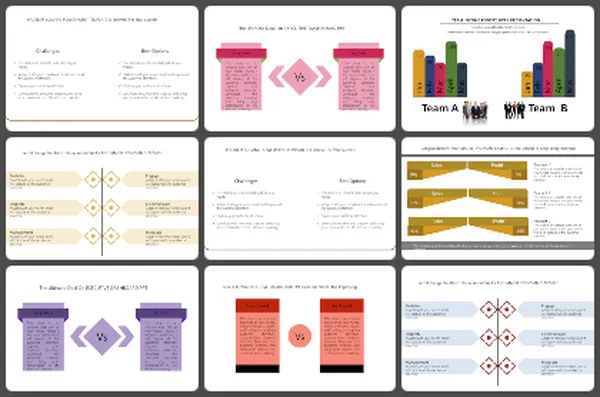
Matrix Presentation Template
Add better insights to your presentation to highlight the significance of analysis by introducing our Matrix PPT and Google Slides Presentation Template. The slide has an axis graph. It is divided into three rows with numerous blocks. It represents different factors of risk. The graph effectively communicates the level of risk, ranging from low to high. More...
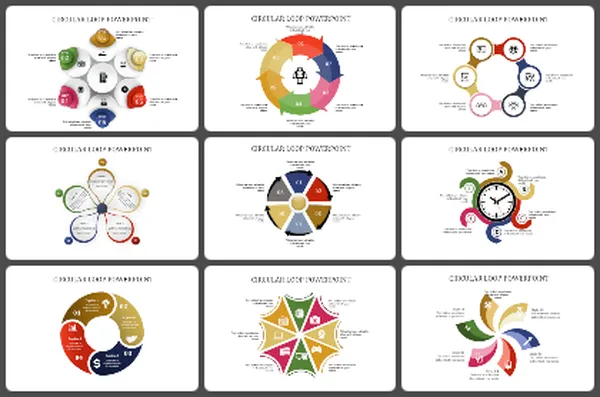
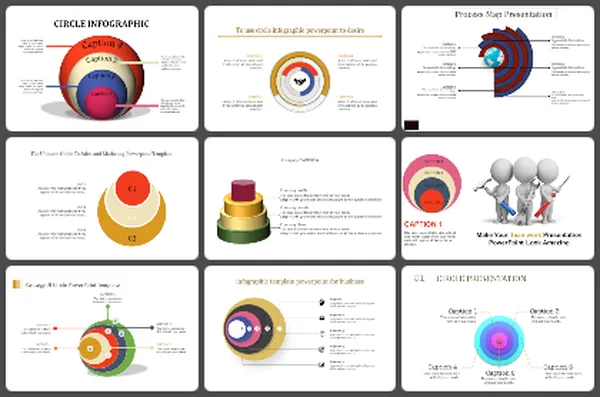
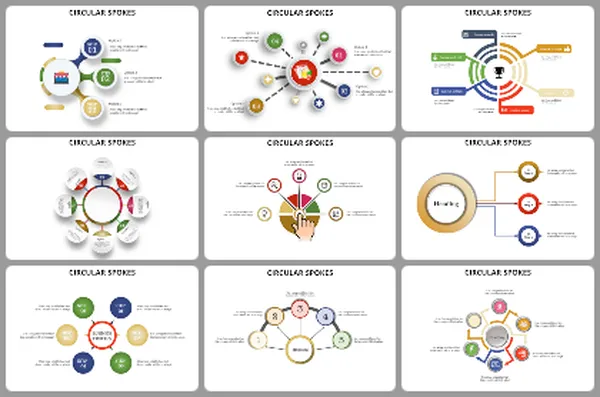
You May Also Like These PowerPoint Templates
Add to Wishlist
Download
AI Customize

Add to Wishlist
Download
AI Customize


Add to Wishlist
Download
AI Customize

Add to Wishlist
Download
AI Customize

Add to Wishlist
Download
AI Customize

Add to Wishlist
Download
AI Customize

Add to Wishlist
Download
AI Customize

Add to Wishlist
Download
AI Customize

Add to Wishlist
Download
AI Customize

Add to Wishlist
Download
AI Customize

Add to Wishlist
Download
AI Customize

Add to Wishlist
Download
AI Customize

Add to Wishlist
Download
AI Customize


Add to Wishlist
Download
AI Customize

Add to Wishlist
Download
AI Customize

Add to Wishlist
Download
AI Customize

Free
Add to Wishlist
Download
AI Customize

Add to Wishlist
Download
AI Customize
