Simple Matrix Presentation Template Slide-Purple Color

Risk matrix chart showing twelve purple boxes for low, medium, and high risk levels placed in a white background.
P.ID : 26462
    113 views
    5 Downloads
    Get Custom Slides by Experts
    Instantly Access Templates in PowerPoint

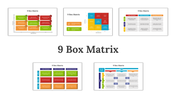
    Take Control of Your Complex Data with Matrix Presentation Templates


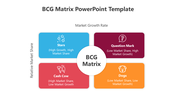
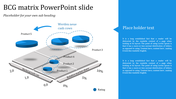
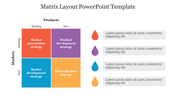
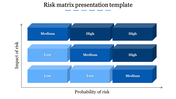
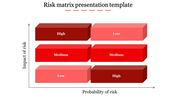
    Struggling to visualize intricate relationships in your PowerPoint or Google Slides presentations? Look no further than our Matrix Presentation Templates!

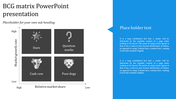
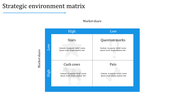
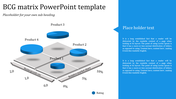
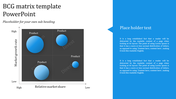
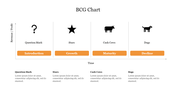
    These pre-designed slides offer a clear and concise way to showcase data with six distinct nodes, each featuring a dedicated caption, title holder, and text area. Perfect for business professionals, consultants, and educators, these templates empower you to present comparisons, strategies, and multi-factor analyses with impactful clarity.

    Ditch the tedious chart building and focus on crafting your message.  Our Matrix Presentation Templates are the key to unlocking a streamlined presentation workflow and leaving a lasting impression on your audience.

    Features of the Template


    • 100 % customisable slides.
    • The slide show is in 4:3, 16:9, zip format.
    • There is powerful connectivity with Google Slides and PowerPoint.
    • It is simple and quick to alter the slide's color.
    • An efficient template that can be easily accessed immediately.
    • Well-crafted template with an instant download facility.
    Advertisement

    You May Also Like These PowerPoint Templates

    Add to Wishlist
    Download
    AI Customize
    Risk matrix diagram using a grid of yellow-toned blocks to visually display risk levels from low to high.
    Add to Wishlist
    Download
    AI Customize
    3D chess themed risk matrix template for PowerPoint with high and low risk quadrants and descriptive text placeholders.
    Add to Wishlist
    Download
    AI Customize
    Bubble chart BCG matrix with product categories: stars, question marks, cash cows, and dogs.
    Add to Wishlist
    Download
    AI Customize
    Ansoff matrix template showing four quadrants divided by axes for existing and new products and markets.
    Add to Wishlist
    Download
    AI Customize
    Ansoff matrix with color-coded squares, ranging from 1A to 3C, indicating performance with placeholder text.
    Add to Wishlist
    Download
    AI Customize
    Slide featuring the Ansoff Matrix, categorizing growth strategies into product and market dimensions.
    Add to Wishlist
    Download
    AI Customize
    Slide showing a BCG matrix with colorful quadrants and icons for Stars, Question Marks, Cash Cows, and Dogs categories.
    Free
    Add to Wishlist
    Download
    AI Customize
    BCG matrix template with red quadrants arranged by market share and growth, including labeled icons.
    Add to Wishlist
    Download
    AI Customize
    Slide deck featuring BCG matrix layouts in bright colors, including icons and categorized business growth stages.
    Add to Wishlist
    Download
    AI Customize
    Four-square matrix with colored sections in red, purple, green, and blue, on a diamond layout, each with captions.
    Add to Wishlist
    Download
    AI Customize
    3x3 priority matrix with green, yellow, and red cells representing high, medium, and low, based on probability and impact.
    Add to Wishlist
    Download
    AI Customize
    Orange gradient 3D risk matrix with blocks labeled low, medium, and high, arranged by impact and probability axes.
    Add to Wishlist
    Download
    AI Customize
    BCG matrix featuring tree icons representing products on a gray grid with labeled axes and a blue side panel for text.
    Add to Wishlist
    Download
    AI Customize
    A four quadrant business succession planning template featuring different focus areas with placeholder text and icons.
    Add to Wishlist
    Download
    AI Customize
    BCG matrix diagram with labeled product bubbles and a placeholder for explanatory text on the right.
    Add to Wishlist
    Download
    AI Customize
    BCG matrix with four labeled quadrants in blue shades, and varied sized circles indicating data points.