Glorious Matrix Presentation Template Slide Design


Visualize Risk Assessment: Matrix Presentation Template
The Matrix presentation templates are the ready-used tools for the evaluation and presentation of risks.
Slide details:
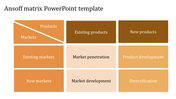
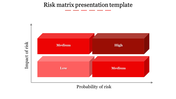
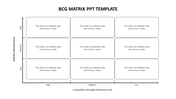
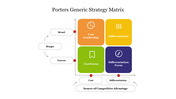
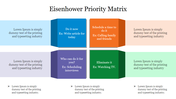
A table or grid is drawn with 8 boxes, indicating different risk levels. They have been set in two horizontal lines and four vertical columns, headed by row headers "Impact of Risk" and "Probability of Risk" and column headers "Low," "Medium," and "High."
Who Can Benefit?
This will be very instrumental to risk managers, project managers, business analysts, and educators required to present risk assessments clearly and effectively. This structured design makes sure that your data is clear and easy to understand.
Purpose of the Slide:
This slide will help in presenting risk levels structured and clear. The matrix format will allow one to have an interpretation of the impact and its probability on different risks.
Download now
Features of the template
- 100% customizable slides and easy to download.
- The slides contain 16:9 and 4:3 formats.
- Easy to change the colors quickly.
- It is a well-crafted template with an instant download facility.
- It is a 100% pre-designed slide.
- The slide holds vibrant colors.


You May Also Like These PowerPoint Templates
Add to Wishlist
Download
AI Customize

Add to Wishlist
Download
AI Customize

Add to Wishlist
Download
AI Customize

Add to Wishlist
Download
AI Customize

Add to Wishlist
Download
AI Customize

Free
Add to Wishlist
Download
AI Customize


Add to Wishlist
Download
AI Customize

Add to Wishlist
Download
AI Customize

Add to Wishlist
Download
AI Customize

Add to Wishlist
Download
AI Customize

Add to Wishlist
Download
AI Customize

Add to Wishlist
Download
AI Customize

Add to Wishlist
Download
AI Customize

Add to Wishlist
Download
AI Customize


Add to Wishlist
Download
AI Customize

Add to Wishlist
Download
AI Customize

Add to Wishlist
Download
AI Customize

Add to Wishlist
Download
AI Customize
