Editable Line Graph Template Slide Design

Line graph template with two lines showing data across seven items, with percentage icons and captions below.
P.ID : 59435
    270 views
    46 Downloads
    Get Custom Slides by Experts
    Instantly Access Templates in PowerPoint

    Editable Graph Template Slide


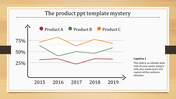
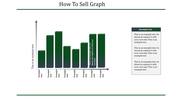
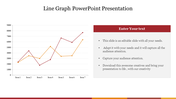
    Download and use this line graph template to create your presentation. This tool is handy for line charts with lots of data points. Without a template, you may find it difficult to understand how the data was calculated. The editable templates can be used for educational purposes and for commercial purposes. These customizable slides will allow you to present your data in a way that will capture the audience's attention.


    About this template


    The Line Graph Template is a pre-made design slide. This graph template is a two-noded format in which you can describe two unique ideas. In addition, you can modify the design of this slide to make your presentation look stunning and mind-blowing. These line graphs will be a beneficial tool for calculating data. Download Now!!


    Features of this template


    • 100 % customizable slides and easy to download. 
    • Slides are available in different nodes & colors.
    • The slide contained in 16:9 and 4:3 format.
    • It is easy to change the slide colors quickly.
    • It is a well-crafted template with an instant download facility.
    • The best PowerPoint theme template.
    • It is a well-designed presentation template.
    Advertisement

    You May Also Like These PowerPoint Templates

    Add to Wishlist
    Download
    AI Customize
    An S shaped curve graph with three key points, illustrating growth or change over time with captions.
    Add to Wishlist
    Download
    AI Customize
    Best Positively Skewed Histogram Presentation Slide
    Add to Wishlist
    Download
    AI Customize
    A bell curve chart slide with an orange shaded area representing percentages for standard deviations.
    Add to Wishlist
    Download
    AI Customize
    A four quadrant graph with colorful sections labeled from 01 to 04 in the center. Each quadrant has placeholder text area.
    Add to Wishlist
    Download
    AI Customize
    Graph representation of the Dunning Kruger effect, mapping confidence levels from know nothing to expert across four stages.
    Add to Wishlist
    Download
    AI Customize
    Editable Kano Model PowerPoint and Google Slides Themes
    Add to Wishlist
    Download
    AI Customize
    Bradley curve chart with four sections in shades of maroon, and orange, illustrating progression through stages.
    Add to Wishlist
    Download
    AI Customize
    Crossing the Chasm PowerPoint Template and Google Slides
    Add to Wishlist
    Download
    AI Customize
    Graph illustrating the law of diminishing marginal return with a curved line between input and output, with labeled sections.
    Add to Wishlist
    Download
    AI Customize
    Graphical representation of a story arc showing stages from exposition to resolution, with labeled points for each action.
    Add to Wishlist
    Download
    AI Customize
    Best Plot Diagram PowerPoint and Google Slides Themes
    Add to Wishlist
    Download
    AI Customize
    Line graph template with two lines showing data across seven items, with percentage icons and captions below.
    Add to Wishlist
    Download
    AI Customize
    Editable Conflict Management Presentation Slides Design
    Add to Wishlist
    Download
    AI Customize
    Best Spider Graph PowerPoint Presentation Template
    Add to Wishlist
    Download
    AI Customize
    Kubler Ross Change Curve PowerPoint And Google Slides
    Add to Wishlist
    Download
    AI Customize
    Eternal Perceptual Map Template PowerPoint Presentation
    Add to Wishlist
    Download
    AI Customize
    Best Positively Skewed Graph PowerPoint Template Slide
    Add to Wishlist
    Download
    AI Customize
    Curved black line graph with red, green, orange, and blue circular markers illustrating fluctuations.