Law of Diminishing Marginal Returns PPT and Google Slides


Law of Diminishing Marginal Returns Presentation Slide
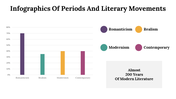
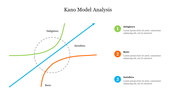
The Law of Diminishing Marginal Returns, also known as the Law of Diminishing Returns or the Law of Variable Proportions, is an economic principle that states that as an increasing amount of one input is added to a fixed amount of other inputs, the overall output will eventually increase at a decreasing rate. This principle is often used to analyze production and resource allocation decisions in various industries. The template includes definitions of key terms, graphs or charts to illustrate the concept, examples of how it applies in real-world situations, and explanations of its implications for businesses and policymakers. It can be used in various industries such as economics, finance, business, and management to explain the concept of diminishing returns. It can be used for educational purposes, professional presentations, and research purposes.
Features of the template
- 100% customizable slides and easy to download.
- Slides are available in different nodes & colors.
- The slides contain 16:9 and 4:3 formats.
- Easy to change the colors quickly.
- It is a well-crafted template with an instant download facility.
- This slide is compatible with Google Slide Themes.
- Creative design with text area.
- Useful slide for a quick presentation.
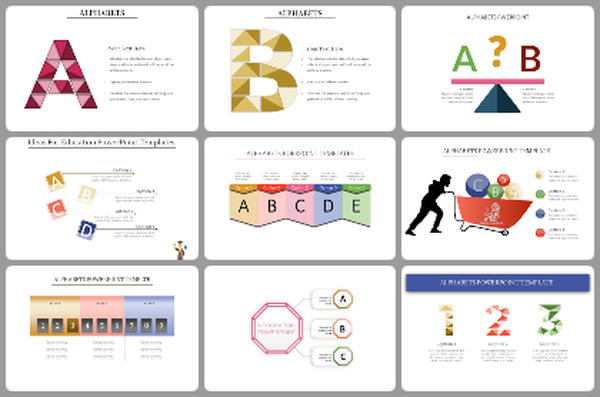
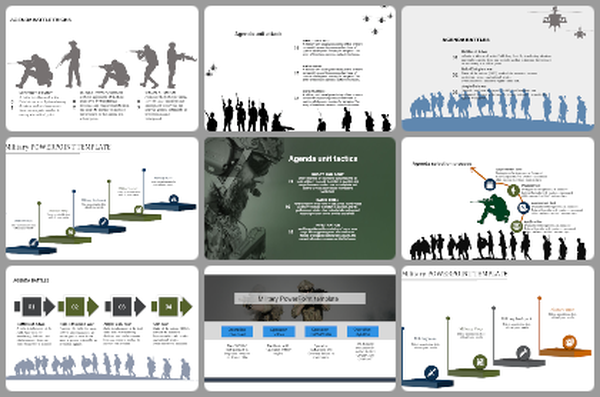
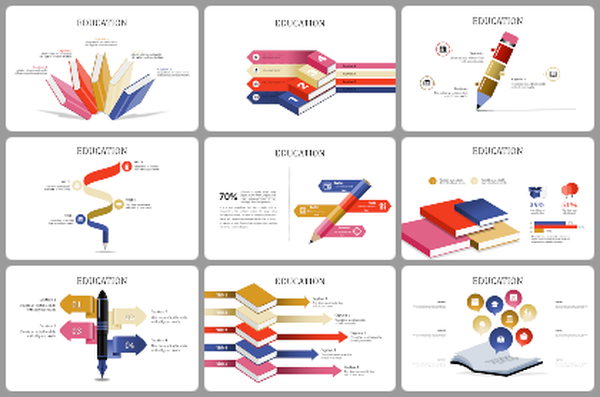

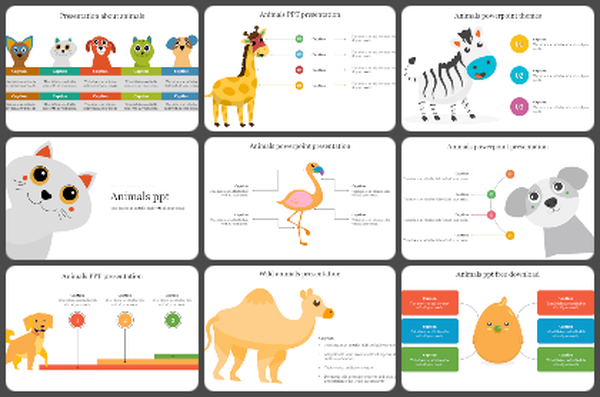

You May Also Like These PowerPoint Templates
Add to Wishlist
Download
AI Customize

Add to Wishlist
Download
AI Customize

Add to Wishlist
Download
AI Customize

Add to Wishlist
Download
AI Customize

Add to Wishlist
Download
AI Customize

Add to Wishlist
Download
AI Customize

Add to Wishlist
Download
AI Customize

Add to Wishlist
Download
AI Customize

Add to Wishlist
Download
AI Customize

Add to Wishlist
Download
AI Customize

Add to Wishlist
Download
AI Customize

Add to Wishlist
Download
AI Customize

Add to Wishlist
Download
AI Customize

Add to Wishlist
Download
AI Customize

Add to Wishlist
Download
AI Customize


Add to Wishlist
Download
AI Customize

Add to Wishlist
Download
AI Customize

