Innovative Kubler Ross Model PowerPoint PPT Template

Line graph representing the Kubler Ross Model with seven emotional stages marked by colored points on a curve.
P.ID : 59145
    333 views
    23 Downloads
    Get Custom Slides by Experts
    Instantly Access Templates in PowerPoint

    Experiment Of Kubler Ross Model PowerPoint Slide


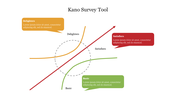
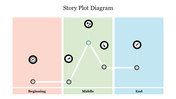
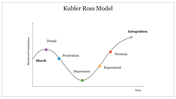
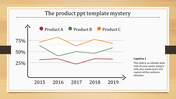
    Want to illustrate the five distinct stages of grief after losing a loved one? You are in the right place. Our Kubler Ross Model PowerPoint Slide has what you need. This template has a graph model with five stages for mental health with captions. However, Our template is mainly used in mental health meetings and team meetings. In addition, Users can use this template for any health presentation with minor changes. At the top of this slide, users can add their titles. You can use this template for a family presentation.  Our Kubler Ross Model PowerPoint slides are 100% editable and customizable. In addition, Users can choose any health graph PowerPoint slide for their needs. It is a pre-built slide and an Easily readable and acceptable template.

    Features of this template

    • 100% Customizable (shape color, size & text)
    • This template has a graph theme, and you can also choose the color
    • Drag and drop image placeholder
    • Huge Collections of slides to impress your audience
    • It supports an aspect ratio of 16:9 and 4:3 format.
    Advertisement

    You May Also Like These PowerPoint Templates

    Add to Wishlist
    Download
    AI Customize
    Unique Chart Presentation For Your Creative Presentation
    Free
    Add to Wishlist
    Download
    AI Customize
    Bar Chart PowerPoint Templates and Google Slides Themes
    Free
    Add to Wishlist
    Download
    AI Customize
    PPT Charts and Graphs Template Presentation & Google Slides
    Free
    Add to Wishlist
    Download
    AI Customize
    Elegant PowerPoint Charts and Graphs Template and Google Slides
    Free
    Add to Wishlist
    Download
    AI Customize
    We have the Best Collection of Chart Presentation Slides
    Add to Wishlist
    Download
    AI Customize
    Slide showing a graph of the Dunning-Kruger Effect with stages from knowing nothing to becoming an expert with a title text.
    Add to Wishlist
    Download
    AI Customize
    Narrative arc slide displaying key plot stages with placeholder text areas.
    Add to Wishlist
    Download
    AI Customize
    Line graph slide with two data series in red and yellow, showing item based data fluctuations and a text caption.
    Add to Wishlist
    Download
    AI Customize
    Graph showing an upward curve with captions along key points, indicating growth or improvement over time.
    Add to Wishlist
    Download
    AI Customize
    Curve Graph PPT Template & Google Slides for Presentation
    Add to Wishlist
    Download
    AI Customize
    A collection of story arc slides featuring graphs illustrating rising action, climax, and resolution points for storytelling.
    Add to Wishlist
    Download
    AI Customize
    An S shaped curve graph with three key points, illustrating growth or change over time with captions.
    Add to Wishlist
    Download
    AI Customize
    Best Positively Skewed Histogram Presentation Slide
    Add to Wishlist
    Download
    AI Customize
    A bell curve chart slide with an orange shaded area representing percentages for standard deviations.
    Add to Wishlist
    Download
    AI Customize
    A four quadrant graph with colorful sections labeled from 01 to 04 in the center. Each quadrant has placeholder text area.
    Add to Wishlist
    Download
    AI Customize
    Graph representation of the Dunning Kruger effect, mapping confidence levels from know nothing to expert across four stages.
    Add to Wishlist
    Download
    AI Customize
    Editable Kano Model PowerPoint and Google Slides Themes
    Add to Wishlist
    Download
    AI Customize
    Bradley curve chart with four sections in shades of maroon, and orange, illustrating progression through stages.