Awesome KPI PPT Presentation Template Designs

KPI slide with two labeled white circles, connected by a line, and a large arrow at the bottom on a textured background.
P.ID : 34187
    121 views
    1 Downloads
    Get Custom Slides by Experts
    Instantly Access Templates in PowerPoint

    KPI Presentation Template


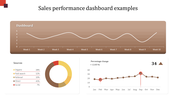
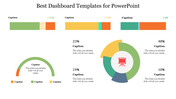
    Tracking and presenting key performance indicators (KPIs) is essential for measuring success and driving improvement. Our KPI PPT Slide Template is designed to clearly and effectively present performance metrics.

    Slide Description:

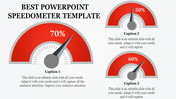
    Our template features two circular diagrams, both labeled “Process KPIs. ”Between these diagrams, there’s a large horizontal arrow pointing from left to right. This slide is completely customizable.

    Purpose of this slide:

    To illustrate a progression or relationship between different process Key Performance Indicators (KPIs). It’s designed for business or educational presentations where KPIs related to organizational processes need to be discussed visually.

    Who can benefit?

    Business analysts: They can use it to explain process KPIs to stakeholders, Project managers: It helps them visualize performance metrics and Anyone interested in understanding and improving business processes through measurable indicators.

    So don't hesitate to download our templates today!

    Features of the template:


    •  Slides are available in 4:3 & 16:9
    • Get slides that are 100% customizable and easy to download
    • Highly compatible with PowerPoint and Google Slides
    Advertisement

    You May Also Like These PowerPoint Templates

    Add to Wishlist
    Download
    AI Customize
    Business dashboard with expense bar chart, executive distribution, sales pie chart, and revenue gauge.
    Add to Wishlist
    Download
    AI Customize
    Green speedometer graphics illustrating performance levels at 70, 50, 55, and 85 percent in a PowerPoint template.
    Add to Wishlist
    Download
    AI Customize
    Chart template featuring bar, line, and calendar charts with editable placeholders for Q1, Q2, and monthly data.
    Add to Wishlist
    Download
    AI Customize
    A tachometer graphic for PowerPoint, featuring different colored sections and text placeholders.
    Add to Wishlist
    Download
    AI Customize
    Four yellow speedometer graphics showing percentages of 70%, 50%, 55%, and 85% placed in a white background.
    Add to Wishlist
    Download
    AI Customize
    Dashboard with a bar chart and pie chart in purple shades, comparing project status across regional shares.
    Add to Wishlist
    Download
    AI Customize
    Dashboard PowerPoint template with progress bars, circular steps, and a multi color bar chart for tracking metrics.
    Add to Wishlist
    Download
    AI Customize
    Dashboard template showing last deposit, transaction, payment types, and data market percentages.
    Add to Wishlist
    Download
    AI Customize
    Colorful speedometer PPT slide with a gauge showing 25 percent and corresponding happy and sad faces with captions.
    Add to Wishlist
    Download
    AI Customize
    Business leadership slide with a table layout showing five titles and corresponding lists, each filled with content.
    Add to Wishlist
    Download
    AI Customize
    Logistics performance dashboard with two circular charts for failure distribution and delivery tracking, and a gauge meter.
    Add to Wishlist
    Download
    AI Customize
    Executive dashboard presentation slide with arrows and title placeholders on a notebook background.
    Add to Wishlist
    Download
    AI Customize
    Tachometer PPT slide with 4 colorful gauges in red, orange, green, and blue, each with caption sections on a white backdrop.
    Add to Wishlist
    Download
    AI Customize
    Dashboard PowerPoint slide featuring pie, bar, and line charts with placeholder text and data visualization.
    Free
    Add to Wishlist
    Download
    AI Customize
    Business slide featuring a circular layout with four orange sections and icons representing key aspects of business.
    Add to Wishlist
    Download
    AI Customize
    KPI dashboard slide with key metrics for business, development, and downloads, showing percentages with icons.