Effective KPI Presentation PowerPoint Template Designs


Tap into Your Data Dynamism with our KPI Dashboard Template
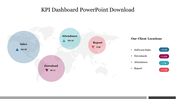
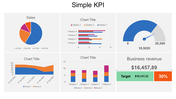
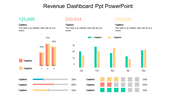
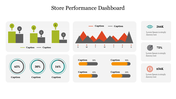
Release the power of data visualization with our dynamic KPI Dashboard PowerPoint Template and Google Slides theme. Crafted to seamlessly integrate with your presentations, this template boasts three distinct nodes, each adorned with crisp captions against a pristine white background. Explore the metrics that matter most with nodes dedicated to revenue ($256,250), sales ($60), and sales value ($20,500). Targeted towards business analysts, project managers, and executives, this tool empowers you to effortlessly communicate key performance indicators. Elevate your presentations with actionable insights, compelling visuals, and streamlined data interpretation. Empower your audience to make informed decisions and drive business success. Seize the moment and transform your data narrative with our KPI Dashboard template today.
Features of the Template
- 100 % customizable slides.
- The slide show is in 4:3, 16:9, zip format.
- There is powerful connectivity with Google Slides and PowerPoint.
- It is simple and quick to alter the slide's color.
- An efficient template that can be easily accessed immediately.
- Well-crafted template with an instant download facility.


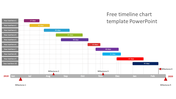
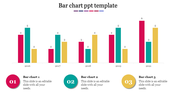
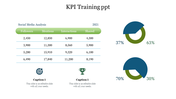
You May Also Like These PowerPoint Templates
Add to Wishlist
Download
AI Customize

Add to Wishlist
Download
AI Customize


Add to Wishlist
Download
AI Customize

Add to Wishlist
Download
AI Customize

Add to Wishlist
Download
AI Customize

Add to Wishlist
Download
AI Customize

Add to Wishlist
Download
AI Customize

Add to Wishlist
Download
AI Customize

Add to Wishlist
Download
AI Customize

Add to Wishlist
Download
AI Customize

Add to Wishlist
Download
AI Customize


Free
Add to Wishlist
Download
AI Customize

Add to Wishlist
Download
AI Customize

Add to Wishlist
Download
AI Customize

Add to Wishlist
Download
AI Customize

Add to Wishlist
Download
AI Customize

Add to Wishlist
Download
AI Customize

Add to Wishlist
Download
AI Customize
