Editable KPI PowerPoint Template and Google Slides Themes

KPI dashboard featuring a bar chart, line graph, and pie chart displaying key performance metrics.
P.ID : 34186
    89 views
    4 Downloads
    Get Custom Slides by Experts
    Instantly Access Templates in PowerPoint

    Editable KPI PowerPoint Template and Google Slides Themes


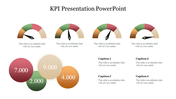
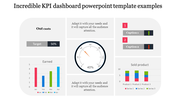
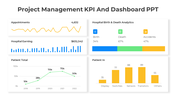
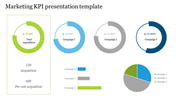
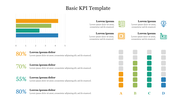
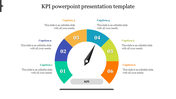
    Empower your presentations with our versatile KPI template. Key Performance Indicators (KPIs) are vital metrics used across industries to gauge performance and inform strategic decisions. Our customizable design elucidates the essence of KPIs, detailing their definition, stakeholders, and critical role in organizational success. 

    Tailor the template to your specific needs, incorporating relevant examples and branding elements seamlessly. With its intuitive layout and visually appealing design, this template enhances clarity and engagement, making complex concepts more accessible to your audience. 

    Whether you're presenting to executives, stakeholders, or team members, our KPI template equips you with the tools to deliver impactful presentations that drive understanding and action. Download now and elevate your presentations to the next level!

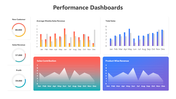
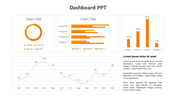
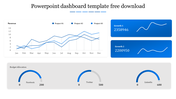
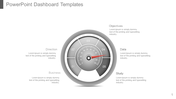
    Features of the template

    • 100% customizable slides and easy to download.
    • Slides are available in different nodes & colors.
    • The slide contains 16:9 and 4:3 formats.
    • It is easy to change the colors of the slide quickly. 
    • Well-crafted template with an instant download facility.
    Advertisement

    You May Also Like These PowerPoint Templates

    Add to Wishlist
    Download
    AI Customize
    KPI dashboard featuring financial data with profit trends and metrics visualized through charts and dials.
    Add to Wishlist
    Download
    AI Customize
    PowerPoint dashboard template displaying Employee Net Promoter Score with a gauge and two emojis.
    Add to Wishlist
    Download
    AI Customize
    Dashboard PPT slide with three colorful speedometers representing varying performance levels on a black background.
    Add to Wishlist
    Download
    AI Customize
    Dashboard slide showcasing a semi circular layout with five numbered segments in blue, red, and green, each with captions.
    Add to Wishlist
    Download
    AI Customize
    Dashboard slide with three blue icons and captions paired with a bar chart on a tablet screen, and a desk setup on the right.
    Add to Wishlist
    Download
    AI Customize
    Business executive dashboard template displaying project information, including date and editor with placeholder text.
    Add to Wishlist
    Download
    AI Customize
    KPI dashboard slide with key metrics for business, development, and downloads, showing percentages with icons.
    Add to Wishlist
    Download
    AI Customize
    KPI slide displaying a financial table for FY 2018, with figures for Net Sales, Income, and Expenses for each quarter.
    Free
    Add to Wishlist
    Download
    AI Customize
    Free KPI PPT Template For Presentation & Google Slides
    Add to Wishlist
    Download
    AI Customize
    Key Performance Indicators (KPI) scorecard template displaying various objectives in colored sections each with text area.
    Free
    Add to Wishlist
    Download
    AI Customize
    KPI PPT Template with three colourful circular progress charts  showing percentages, growth indicators, and  bar charts.
    Add to Wishlist
    Download
    AI Customize
    KPI dashboard slide showing multiple charts, including bar, line, pie, and gauge charts with tracking business data.
    Free
    Add to Wishlist
    Download
    AI Customize
    KPI Template PPT Presentation Slide With Bar Chart
    Add to Wishlist
    Download
    AI Customize
    Four semi circular charts showing shipment percentages by country, with icons below for delivery status and order rates.
    Add to Wishlist
    Download
    AI Customize
    KPI report slide displaying software sales, downloads, and attendance metrics with speedometer gauges and growth indicators.
    Add to Wishlist
    Download
    AI Customize
    Logistics KPI PowerPoint Template and Google Slides
    Add to Wishlist
    Download
    AI Customize
    Two circular charts show metrics in red and green, representing key performance indicators for warehouse operations.
    Add to Wishlist
    Download
    AI Customize
    KPI slide highlighting essential business metrics alongside color coded sections for quick reference and analysis.