KPI Infographics PowerPoint And Google Slides Themes

Pack of 36 slides
P.ID : 69763
Advertisement
1.8K+ views
419 Downloads
Get Custom Slides by Experts
Instantly Access Templates in PowerPoint

KPI Infographics PowerPoint Slides

Let's face it. Proposing your company's performance to the higher-ups is no fun. They want a way to quickly comprehend the state of affairs without scouring through slides and spreadsheets. That's where Key Performance Indicators come in! If you love vibrance and are tired of the same old graphs, KPIs are for you.

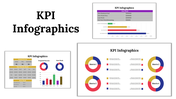
Here is our elegant set of KPI Infographics PPT Slides that will charge up your investors and help you make it to the next level. Manage your KPIs like a pro with this pack of editable slides! More...


You May Also Like These PowerPoint Templates

Free
Add to Wishlist
Download
AI Customize
PowerPoint presentation slide featuring a stacked bar chart, aerial landscape photo, and a comparison table of drone data.
Add to Wishlist
Download
AI Customize
A medical themed PowerPoint slide with three colorful circular progress bars showing percentages, each with related icons.
Add to Wishlist
Download
AI Customize
Chart with five blue vertical bars showing percentages, paired with captions, on a white background.
Add to Wishlist
Download
AI Customize
Bar chart with green hues, showing data for six categories, with side status boxes and light text.
Add to Wishlist
Download
AI Customize
3D cone chart with orange, pink, and blue segments, placed on a gray platform with a white background.
Add to Wishlist
Download
AI Customize
Slide featuring three green pie charts and a line graph below, illustrating data trends for different categories.
Free
Add to Wishlist
Download
AI Customize
Bar graph showing revenue and sales data for 3D Ocean, Web, Graphics, Video, and Design in a business plan presentation.
Free
Add to Wishlist
Download
AI Customize
Pyramid infographic with four golden pyramids in ascending order, marked with percentages 10% to 40% on a dark base.
Add to Wishlist
Download
AI Customize
Customized Kubler Ross PowerPoint Presentation Template
Free
Add to Wishlist
Download
AI Customize
Chart infographic with four drop shaped gauge style meters in blue, green, yellow, and red, each with text below.
Free
Add to Wishlist
Download
AI Customize
Infographic with a circular segmented chart in blue shades, centered around an AI head graphic placed in white background.
Free
Add to Wishlist
Download
AI Customize
Pie chart slide with a blue and dark blue donut chart showing 75% sales, two numbered text boxes on the right.
Add to Wishlist
Download
AI Customize
Creative PowerPoint slide with two lines on a chart yellow and red with a green dot marking the highest point on the line.
Add to Wishlist
Download
AI Customize
Bar chart slide showing the performance of four products with categories like sales growth, market share, and profit margin.
Add to Wishlist
Download
AI Customize
Colorful timeline PowerPoint chart illustrating shifts for various employees throughout the day with peak hours highlighted.
Free
Add to Wishlist
Download
AI Customize
Green bar graph depicting growth over six months, with two gear icons and captions on the left.
Add to Wishlist
Download
AI Customize
Slide featuring a financial report with bar charts and a table, showing website and a percentage statistic on the right.
Add to Wishlist
Download
AI Customize
Visual of boost engagement growth with stacked bar categories: newsletter sign-ups, premium customers, and followers.
Add to Wishlist
Download
AI Customize
Dual chart template slide with scatter and bubble charts, the scatter chart on the left and the bubble chart on the right.
Add to Wishlist
Download
AI Customize
Three vertical rectangular sections with headers in green, blue, and orange, each with captions inside.
Free
Add to Wishlist
Download
AI Customize
Green and black area chart with a star shaped yellow badge and four circular icons with text below.
Free
Add to Wishlist
Download
AI Customize
Three column layout with blue megaphone, orange lightbulb, and red envelope icons on a beige background.
Add to Wishlist
Download
AI Customize
Slide featuring a businessman pointing at a board with a pie chart and two circular progress visuals in red and yellow.
Free
Add to Wishlist
Download
AI Customize
Business plan infographic with a four-quadrant layout labeled with sales strategies and a 3D pie chart on the right.
Free
Add to Wishlist
Download
AI Customize
Chart slide with four interlinked circular diagrams, and two radar charts in blue and green at the bottom.
Free
Add to Wishlist
Download
AI Customize
Horizontal bar chart with green and gray bars of varying lengths, labeled with placeholder text, on a light background.
Add to Wishlist
Download
AI Customize
Pie charts showing data percentages for growth, with three percentage values with placeholder text.
Free
Add to Wishlist
Download
AI Customize
Slide with green and white sections, featuring pie and bar charts, and an engine image in the bottom right corner.
Add to Wishlist
Download
AI Customize
Colorful pie chart PowerPoint slide with five labeled sections and captions on a white backdrop.
Free
Add to Wishlist
Download
AI Customize
Creative infographic with a curved orange graph divided into four steps, each with an icon and label.
Free
Add to Wishlist
Download
AI Customize
A simple chart slide with overlaid blue, green, orange, and yellow circles of varying sizes with a graph and captions.
Add to Wishlist
Download
AI Customize
PowerPoint slide showcasing a chart with project status trends and a progress bar for each year.
Add to Wishlist
Download
AI Customize
Four panel chart slide featuring a line, bar, and pie chart, each displaying data trends and comparisons.
Free
Add to Wishlist
Download
AI Customize
Pie chart with four segments in white and green on a dark patterned background, alongside a text box for description.
Add to Wishlist
Download
AI Customize
Four pencil-shaped bars for education in orange, blue, red, and green representing data from 2011 to 2014 with values.