Free - Informative KPI Dashboard Template Download Slide PPT

Free
KPI dashboard with percentage stats, bar charts, and flow diagrams in red, blue, and orange representing data trends.
P.ID : 66738
    2.5K+ views
    1000 Downloads
    Get Custom Slides by Experts
    Instantly Access Templates in PowerPoint

    Effective KPI Dashboard Presentation Template Download 


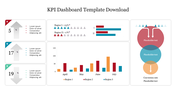
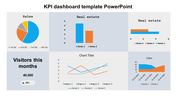
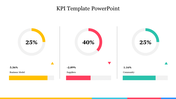
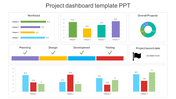
    Get this KPI dashboard template free download slide; it is about a tool that unites the data sources and provides visual feedback by showing how the business is performing against your key performance indicators. Try this KPI PowerPoint slide to present your business's actual performance to the audience.

    About the template:

    Grab this KPI dashboard template free download template that contains a white background that enriches the quality of your slide to look brighter while presenting. And the template has various graph representations in different colors in a creative way. The template also contains the editable texts for you to modify and add more information; customize the slide with different graph representations to make your template an informative presentation to your audience. Download this slide to give a visual presentation and make it a practical template. And try our other KPI scorecard slides from SlideEgg.

    Features of the slide:

    1.100% customizable slides and easy to download.
    2. Slides available in different nodes & colors.
    3. The slides contained 16:9 and 4:3 formats.
    4. Easy to change the slide colors quickly.
    5. Well-crafted template with instant download facility.
    6. The KPI slide for the informative slide.
    Advertisement

    You May Also Like These PowerPoint Templates

    Add to Wishlist
    Download
    AI Customize
    KPI dashboard slide showing multiple charts, including bar, line, pie, and gauge charts with tracking business data.
    Add to Wishlist
    Download
    AI Customize
    Smart chart template slide showing bar and line charts labeled net profit alongside numbered caption area.
    Free
    Add to Wishlist
    Download
    AI Customize
    KPI Template PPT Presentation Slide With Bar Chart
    Add to Wishlist
    Download
    AI Customize
    A bubble chart slide with four quadrants featuring colorful icons for key business strategies with a placeholder text area.
    Add to Wishlist
    Download
    AI Customize
    Radar PowerPoint Presentation Templates and Google Slides
    Add to Wishlist
    Download
    AI Customize
    Relationship chart slide with colored blocks connected by curving lines representing data flow with placeholder text.
    Add to Wishlist
    Download
    AI Customize
    Pentagon-shaped spider chart displaying two datasets in red and blue with two numbered caption areas.
    Add to Wishlist
    Download
    AI Customize
    Colorful pie chart with four segments in blue, purple, red, and orange, with matching text boxes showing percentages.
    Add to Wishlist
    Download
    AI Customize
    Editable Cockpit Charts PowerPoint Slide Template Design
    Add to Wishlist
    Download
    AI Customize
    Blank chart slide with a weekly layout from monday to sunday, featuring a grid for scheduling or organizing tasks.
    Free
    Add to Wishlist
    Download
    AI Customize
    Cute PowerPoint Radar Chart Templates For Presentation
    Add to Wishlist
    Download
    AI Customize
    Hoshin Kanri slide with a blue grid design labeled sections for annual objectives and a compass icon at the bottom.
    Add to Wishlist
    Download
    AI Customize
    Bar graph on a slide showing data from 2016 to 2019, with a title about statistics and a caption area section.
    Add to Wishlist
    Download
    AI Customize
    Pareto Analysis PowerPoint And Google Slides Template
    Add to Wishlist
    Download
    AI Customize
    Editable Dot Charts PowerPoint Template For Presentation
    Add to Wishlist
    Download
    AI Customize
    Slide showcasing survey data with percentage figures in colored text boxes and icons with a comparative bar chart.
    Add to Wishlist
    Download
    AI Customize
    Hexagonal web chart with blue and red lines showing financial data for six business areas at the corners.
    Add to Wishlist
    Download
    AI Customize
    Best Change Curve PowerPoint Template Readily For You
    Add to Wishlist
    Download
    AI Customize
    Innovative Cockpit Charts PowerPoint Download PPT Slides