KPI Dashboard Template Slide For Private School Growth


Creative KPI Dashboard Templates and Google Slides
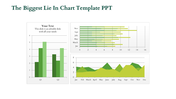
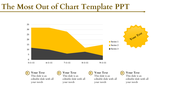
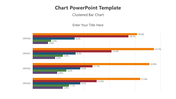
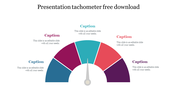
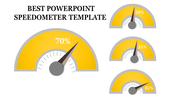
A KPI dashboard template serves as a powerful tool for tracking key performance indicators, enabling efficient business monitoring and decision-making. Designed with graph elements, this template features a visually appealing layout with a predominant yellow color scheme, enhancing data visibility and clarity. The dashboard typically comprises four nodes representing distinct KPIs, allowing users to easily grasp essential metrics. Whether used in numbers or business presentations, this template ensures a seamless and informative visual representation of performance data. For those seeking inspiration, numerous KPI dashboard examples showcase the versatility and effectiveness of this tool, demonstrating its adaptability across various industries and purposes.
Features of the template:
- Slides are available in different nodes & colors.
- Easy to change the slide colors.
- Well-crafted template with instant download.
- 100 % customizable slides and easy to download.
- Well-crafted template with instant download.


You May Also Like These PowerPoint Templates

Add to Wishlist
Download
AI Customize

Add to Wishlist
Download
AI Customize


Add to Wishlist
Download
AI Customize

Add to Wishlist
Download
AI Customize

Add to Wishlist
Download
AI Customize

Add to Wishlist
Download
AI Customize

Add to Wishlist
Download
AI Customize

Add to Wishlist
Download
AI Customize

Add to Wishlist
Download
AI Customize


Add to Wishlist
Download
AI Customize

Add to Wishlist
Download
AI Customize

Add to Wishlist
Download
AI Customize


Add to Wishlist
Download
AI Customize

Add to Wishlist
Download
AI Customize

Add to Wishlist
Download
AI Customize

Add to Wishlist
Download
AI Customize
