Try Our Predesigned KPI Dashboard Template Presentation

KPI dashboard template with bar and line graphs showing private school growth for 2017, 2018, and 2019 with educational data.
P.ID : 1787
    1.4K+ views
    72 Downloads
    Get Custom Slides by Experts
    Instantly Access Templates in PowerPoint

    Try Our Predesigned KPI Dashboard Template Presentation


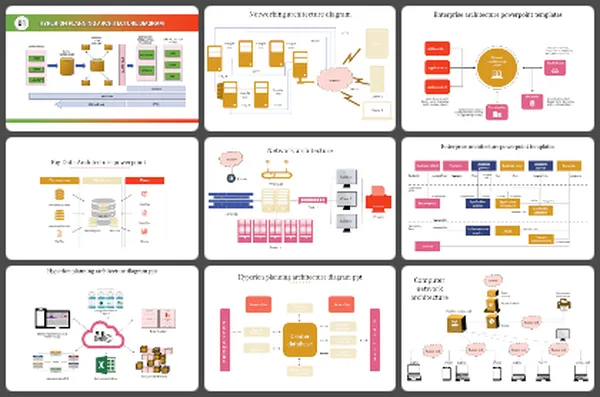
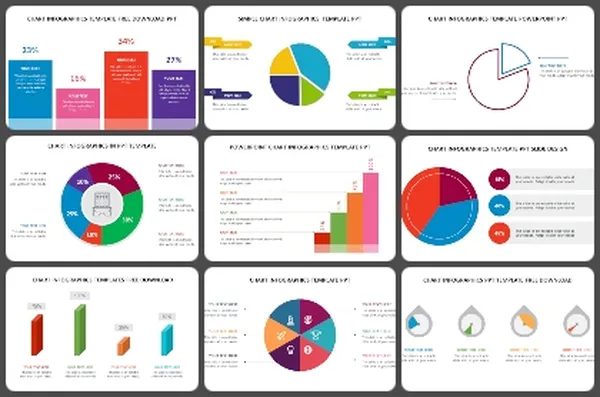
    This Editable template features a clean and modern design with a focus on clear communication and actionable insights. It includes pre-built dashboards for common business goals like sales, marketing, finance, and customer service, making it easy to get started quickly. Plus, it's fully customizable, so you can tailor it to your specific More...

    Advertisement

    You May Also Like These PowerPoint Templates

    Add to Wishlist
    Download
    AI Customize
    Colorful infographic with a line graph, pie and bar chart, and numerical data panels in a structured KPI template design.
    Add to Wishlist
    Download
    AI Customize
    Professional setting with pie charts showing task distribution in red tones for analysis, collection, and development.
    Add to Wishlist
    Download
    AI Customize
    Project overview dashboard template with area chart, line charts for time intervals, and percentage indicators.
    Add to Wishlist
    Download
    AI Customize
    Slide with three tachometer dials in blue, purple, and pink, each aligned above a matching caption box.
    Add to Wishlist
    Download
    AI Customize
    Three pie charts in red, yellow, and blue with percentage values, arranged horizontally with text below.
    Add to Wishlist
    Download
    AI Customize
    Dashboard template showing sales, orders, visitors, and users metrics with visual bar and pie charts for website analysis.
    Add to Wishlist
    Download
    AI Customize
    Dashboard template with a semi-circular gauge indicating performance with a blurred image and caption areas.
    Add to Wishlist
    Download
    AI Customize
    Colorful Tachometer slide with color coded sections from light to BMI with placeholder text.
    Add to Wishlist
    Download
    AI Customize
    Dashboard graphics displaying vehicle speeds with a data table listing vehicles, brands, and status.
    Add to Wishlist
    Download
    AI Customize
    Six-month Gantt chart template spanning July to December 2020 with weekly divisions and task rows.
    Add to Wishlist
    Download
    AI Customize
    Dashboard slide showing plant growth data with details table and area chart for Zantedeschia, Celosia, and Calendula.
    Add to Wishlist
    Download
    AI Customize
    Slide featuring a blue-toned pie chart representing sales revenue percentages, with captions areas for each segment.
    Add to Wishlist
    Download
    AI Customize
    Row of pie charts with varying color schemes for data visualization each place diwth caption areas.
    Add to Wishlist
    Download
    AI Customize
    Colorful progress bars in rows, showing numbered squares in red, teal, purple, and blue, with text on the right.
    Add to Wishlist
    Download
    AI Customize
    Gradient peaks showing sales growth percentages in shades of blue and gray, with detailed text on the right dark sidebar.
    Add to Wishlist
    Download
    AI Customize
    Dashboard chart displaying social media subscribers by gender, age, most read articles, and categories in 2019.
    Add to Wishlist
    Download
    AI Customize
    Five segment pie chart in orange, blue, red, green, and pink, each with number and connected with text areas.