Free - KPI Dashboard PowerPoint Template For Google Slides

Free
KPI dashboard slide showcasing various business metrics through colorful bar charts, pie charts, and a gauge meter.
P.ID : 1807
    24K+ views
    7.5K+ Downloads
    Get Custom Slides by Experts
    Instantly Access Templates in PowerPoint

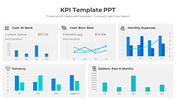
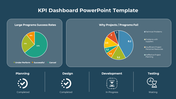
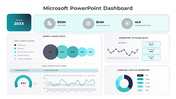
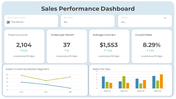
    Business KPI Dashboard Presentation Template 

    Download this KPI Dashboard PowerPoint Template to visually represent the key performance of your business. It is used as a reference to understand the trends in the company's business. It is handy because it is easy to customize and gives an overview of key performance indicators and metrics. The main advantage of a KPI PowerPoint template is that it is effortless to read and understand. 

    About the template:

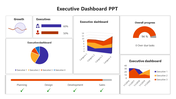
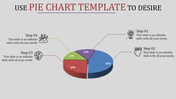
    The KPI Dashboard PowerPoint Template is designed with different types of charts. It has a multi-color pie chart, column charts, etc. It helps to present the various percentage levels of your business key performance more clearly and understandably.  It also helps to present customer and supplier information. The chart model can be customized by changing the chart's size, colors, and data values. It is beneficial when you do a simple analysis of your company and displayed data on the chart. 

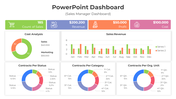
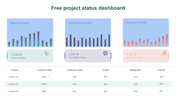
    The KPI Dashboard PowerPoint Template is a very easy-to-use and flexible PowerPoint template that can be used to analyze customer relations, financial reports, and many other types of business information. Using this template, you can make creative and informative presentations without any technical knowledge. So download it today and start to analyze your business to maximize the performance.

    Features of this template:

    1. 100 % customizable slides and easy to download.
    2. Slides available in different nodes & colors.
    3. Slide contained in 16:9 and 4:3 format.
    4. Easy to change the slide colors quickly.
    5. Well-crafted template with instant download facility.
    6. Outstanding KPI dashboard design.
    Advertisement

    You May Also Like These PowerPoint Templates

    Free
    Add to Wishlist
    Download
    AI Customize
    A slide showing a colorful KWL chart with sections for knowledge, inquiry, and learning outcomes with placeholder text.
    Free
    Add to Wishlist
    Download
    AI Customize
    Pie chart presentation slide showing three charts with percentages with text placeholders.
    Free
    Add to Wishlist
    Download
    AI Customize
    Six charts in different formats, including line, pie, bar, and gauge, all in blue and gray, displaying data trends.
    Add to Wishlist
    Download
    AI Customize
    A bar chart with four categories displaying stacked colored bars, representing three series in orange, blue, and red.
    Add to Wishlist
    Download
    AI Customize
    Tachometer slide with four gauges in orange, red, blue, and green, each with captions below describing different readings.
    Add to Wishlist
    Download
    AI Customize
    Dashboard with bar charts, line graphs, and a gauge chart in various colors and a percentage indicator, on white background.
    Add to Wishlist
    Download
    AI Customize
    Circular chart with seven pastel colored segments, each with  icons and captions around it.
    Add to Wishlist
    Download
    AI Customize
    Dashboard template with three fuel gauge icons, each showing different fuel levels with placeholder text.
    Add to Wishlist
    Download
    AI Customize
    3D bar chart with green, red, yellow, and blue bars for business metrics, with a percentage indicator on the right.
    Add to Wishlist
    Download
    AI Customize
    Circular progress indicators in purple, red, blue, and teal, each paired with a percentage and a relevant icon.
    Add to Wishlist
    Download
    AI Customize
    Pie chart slide showing budget distribution for facebook, google, and linkedIn ads with respective percentages.
    Add to Wishlist
    Download
    AI Customize
    Project management dashboard slide with visually colored charts and graphs displaying task status with icons.
    Add to Wishlist
    Download
    AI Customize
    Visual KPI layout with performance bar chart, doughnut chart, and percentage indicators for project analysis.
    Add to Wishlist
    Download
    AI Customize
    Dashboard PowerPoint Template and Google Slides
    Add to Wishlist
    Download
    AI Customize
    KPI dashboard layout with a yellow header, two gauge in teal and green, bar metrics, and pie charts on a light background.
    Add to Wishlist
    Download
    AI Customize
    Row of four colored speedometer-style gauges, each showing varying percentages with needle, and captions at the bottom.
    Add to Wishlist
    Download
    AI Customize
    Three pie charts in brown, blue, and green sections, each with labeled percentages and caption lines.
    Free
    Add to Wishlist
    Download
    AI Customize
    Multicolored circular pie chart in yellow, red, and green, with labeled categories listed on the right.
    Add to Wishlist
    Download
    AI Customize
    Seven rectangular sections with financial data on top and visual charts below, bordered in blue with organized text.