Amazing Kano Survey Tool PowerPoint Presentation Slide


Attractive Kano Survey Tool Template Presentation Slide PPT
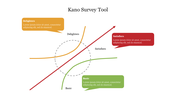
Get this kano survey tool; it is an analysis tool to explore and measure the customer needs. It is the way to identify the basic needs of the customers and the performance of the requirements. Try this graph slide for the innovative presentation.
About the template
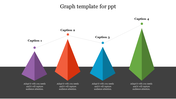
Grab this kano survey tool template with a white background that gives an enhanced quality with a brighter look to the template when you present with animated images and graphs. And the template has three different graph lines in various colors to differentiate. The template has textboxes in various colors with editable texts for you to edit and modify the information to make the presentation effective. You can edit and modify the features in the template with the provided editable designs from SlideEgg.
Download this creative tool slide for a valuable presentation about the kano survey to your audience. And explore our other slides of single PowerPoint templates for the presentation from SlideEgg.
Features of the slide
- 100% customizable slides and easy to download.
- Slides are available in different nodes & colors.
- The slides contained 16:9 and 4:3 formats.
- Easy to change the slide colors quickly.
- Well-crafted template with instant download facility.
- The survey tool slides for the PPT presentation.


You May Also Like These PowerPoint Templates
Add to Wishlist
Download
AI Customize

Add to Wishlist
Download
AI Customize

Add to Wishlist
Download
AI Customize

Add to Wishlist
Download
AI Customize

Add to Wishlist
Download
AI Customize

Add to Wishlist
Download
AI Customize

Add to Wishlist
Download
AI Customize

Add to Wishlist
Download
AI Customize

Add to Wishlist
Download
AI Customize

Add to Wishlist
Download
AI Customize

Add to Wishlist
Download
AI Customize

Add to Wishlist
Download
AI Customize

Add to Wishlist
Download
AI Customize

Add to Wishlist
Download
AI Customize

Add to Wishlist
Download
AI Customize

Add to Wishlist
Download
AI Customize

Add to Wishlist
Download
AI Customize

Add to Wishlist
Download
AI Customize

Add to Wishlist
Download
AI Customize

Add to Wishlist
Download
AI Customize
