Free - Free Ishikawa Diagram Template PowerPoint and Google Slides

Free
Gray fishbone diagram with four numbered sections in red, blue, green, and yellow, each with text on a white background.
P.ID : 65594
    2.8K+ views
    672 Downloads
    Get Custom Slides by Experts
    Instantly Access Templates in PowerPoint

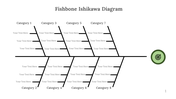
    Ishikawa Presentation Slide

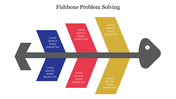
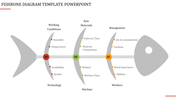
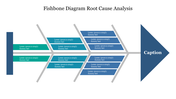
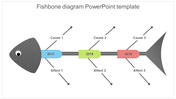
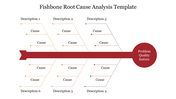
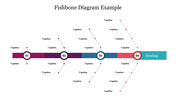
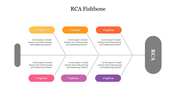
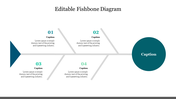
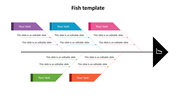
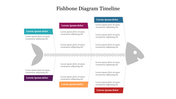
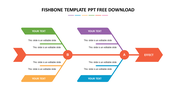
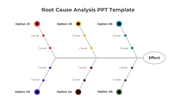
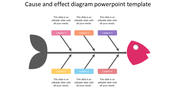
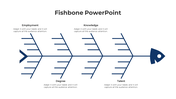
    Ishikawa, also known as the fishbone diagram or cause-and-effect diagram, is a visual tool used to analyze and identify the possible causes of a problem. The diagram is shaped like a fishbone and is divided into categories such as people, methods, machines, materials, and environment. By using the Ishikawa diagram, teams can identify and address the root cause of a problem, which helps to improve the overall quality of a product or process. By using our template you can convey your message in a clear and concise manner.

    Features of the template:

      • 100 % customizable template and easy to download. 
      • Template are available in different nodes & colors.
      • The template is contained in 16:9 and 4:3 format.
      • Easy to change the template colors quickly.
      • Highly compatible with PowerPoint and google slides.
      • Visualize the factors behind your challenges with the Ishikawa fishbone diagram.
      Advertisement

      You May Also Like These PowerPoint Templates

      Add to Wishlist
      Download
      AI Customize
      Fishbone diagram with six branches labeled by captions and three colored circles numbered 1, 2, and 3 along the center.
      Free
      Add to Wishlist
      Download
      AI Customize
      Horizontal fishbone diagram with three numbered sections in blue, red, and yellow circles, leading to a large gray caption.
      Add to Wishlist
      Download
      AI Customize
      Stylized fishbone model with teal, maroon, and red segmented arrows with diamond letter label, leading to a central axis.
      Add to Wishlist
      Download
      AI Customize
      Fishbone diagram analysis slide with labeled sections branching from a central line, leading to a main topic with text area.
      Add to Wishlist
      Download
      AI Customize
      Fishbone diagram with colored segments in orange, purple, red, blue, teal, and green, connected to a central horizontal axis.
      Add to Wishlist
      Download
      AI Customize
      Blue fishbone diagram with a stylized skeleton, featuring four sections on the body with captions.
      Free
      Add to Wishlist
      Download
      AI Customize
      Infographic resembling a fishbone structure, with five segments, connected by red arrows toward the right.
      Add to Wishlist
      Download
      AI Customize
      Fishbone diagram with an orange tail and head, with gradient body segmented into sections illustrating various factors.
      Add to Wishlist
      Download
      AI Customize
      Fishbone cause and effect diagram with labeled causes and effects for problem solving analysis.
      Add to Wishlist
      Download
      AI Customize
      Fishbone diagram template with labeled categories branching to identify causes of treatment delays.
      Add to Wishlist
      Download
      AI Customize
      Ishikawa diagram slide displaying a fishbone diagram with labeled sections and captions with placeholder text.
      Add to Wishlist
      Download
      AI Customize
      Fishbone diagram slide with yellow and blue branches with text elements and icons.
      Add to Wishlist
      Download
      AI Customize
      Fishbone diagram layout with red, green, and yellow circular nodes connecting gray side captions in a flow.
      Add to Wishlist
      Download
      AI Customize
      Fishbone diagram with colorful arrows and segments branching from a central spine, ending in a multicolored triangular head.
      Add to Wishlist
      Download
      AI Customize
      A fishbone diagram with turquoise, yellow, and red triangular sections pointing to a gray head on a horizontal line.
      Add to Wishlist
      Download
      AI Customize
      Fishbone diagram template with categories like machinery, method, people, and environment.
      Add to Wishlist
      Download
      AI Customize
      Fishbone structure with a blue arrowhead and tail and four numbered colorful nodes along a spine on a black background.
      Add to Wishlist
      Download
      AI Customize
      Blue arrow shaped fishbone chart with vertical bars in red, green, purple, and orange showcasing percentages.