Investment PowerPoint Template And Google Slides Themes

Investment PPT slide with progress bars representing various areas from the facility and machine web digital solutions.
P.ID : 32820
    308 views
    9 Downloads
    Get Custom Slides by Experts
    Instantly Access Templates in PowerPoint

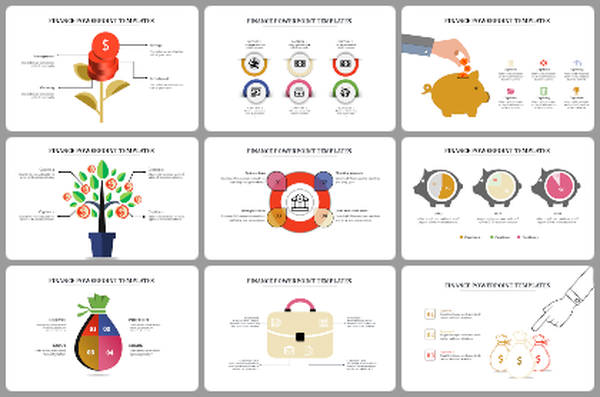
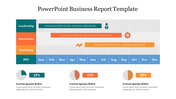
    Investment Presentation Template

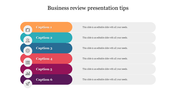
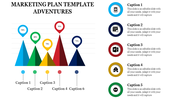
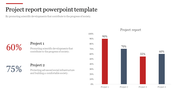
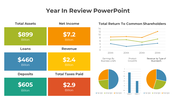
    Make complicated money information easy with our Investment PowerPoint Template and Google Slides. The slide shows long red reports with a small  flag to point out important stuff. You can easily add important numbers, guesses, and ideas with spaces you can type in. The  template can be used in finance, start-ups, corporations, consulting, real estate, private equity, government, and education sectors for pitching investment opportunities, financial strategies, or business plans. It's easy to change, so you can focus on making your message clear. To use it well, make sure your stuff makes sense, use pictures to show important things, and make it look like your own. Practice talking and listening to people to make your talk good. Get our template now to get better at talking and make people like listening to you.

    Features of the template:

    • Slides are available in different nodes & colors.
    • Easy to change the slide colors.
    • Well-crafted template with instant download.
    Advertisement

    You May Also Like These PowerPoint Templates

    Add to Wishlist
    Download
    AI Customize
    Table showing monthly sales data for 2020 with targets, percentage achieved, and status using colored arrows.
    Add to Wishlist
    Download
    AI Customize
    Eye-catching Red PowerPoint Design Slide Templates
    Add to Wishlist
    Download
    AI Customize
    A four column financial report with Q1 to Q4 data, including categories like sales, cost of goods sold, and net profit.
    Add to Wishlist
    Download
    AI Customize
    A colorful Monday weekly planner slide with hourly slots from 7.00 AM to 1.00 PM, a to do list, and text sections.
    Add to Wishlist
    Download
    AI Customize
    Company report slide with a diagonal split design, featuring a tablet displaying analytics and two percentage data sections.
    Add to Wishlist
    Download
    AI Customize
    Work report slide showing hands typing on a laptop, with a coffee cup, notebook, phone, and headphones on a wooden table.
    Add to Wishlist
    Download
    AI Customize
    Weekly report layout PowerPoint slide featuring days of the week and a calendar with placeholder text on a white backdrop.
    Add to Wishlist
    Download
    AI Customize
    Sales report slide with a world map and a ranking table on the right, listing branches, countries, sales, and managers.
    Add to Wishlist
    Download
    AI Customize
    Cute weekly schedule design featuring colorful sticky notes for Monday to Sunday on a purple backdrop.
    Add to Wishlist
    Download
    AI Customize
    A PPT slide showing survey results with bar graphs and financial data on a laptop screen with placeholder text.
    Add to Wishlist
    Download
    AI Customize
    Product sales report slide with a gray monitor illustration and six labeled icons for different item categories.
    Free
    Add to Wishlist
    Download
    AI Customize
    Sales report template featuring a computer monitor in brown and six captions with icons for products.
    Free
    Add to Wishlist
    Download
    AI Customize
    Two percentage sections with construction site images with workers, and a text with title on the right.
    Add to Wishlist
    Download
    AI Customize
    A 3D pie chart with purple, blue, green, teal, and orange segments showing company annual expenses in various categories.
    Add to Wishlist
    Download
    AI Customize
    Illustration of a business team discussing annual report strategies with data icons in the green background.
    Add to Wishlist
    Download
    AI Customize
    Annual report chart showing income percentages for four categories, with accompanying text for a quarter expansion.
    Add to Wishlist
    Download
    AI Customize
    3D bar chart company report featuring cone-shaped data points for January, February, and March under four categories.