Infographics Of Maturity Models PPT And Google Slides


Infographics Of Maturity Models Presentation Slide
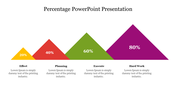
Get ready to boost your comprehension and grab your audience's attention! Explore the Interactive Folders Infographics for Maturity Models in our template. Elevate your presentations, educate your peers, and make your message crystal clear. Download our maturity model template now and revolutionize your communication. Your audience will love the clarity and engagement these infographics PPT designs provide, all accompanied by the visual charm of the five percentage wheels. Begin your transformative journey today and consider applying this template to highlight the Diversity and Inclusion Maturity Model effectively.
Features of the template
- 100% customizable slides and easy to download.
- Slides are available in different colors
- The slide has 4:3 and 16:9 formats.
- Easy to change the slide colors quickly.
- Appealing Presentation to impress an audience.
- Create feature-rich slide presentations.
- An eye-pleasing color slide helps to give a catchy display.
- Highly compatible with PowerPoint and Google Slides.


You May Also Like These PowerPoint Templates
Add to Wishlist
Download
AI Customize

Add to Wishlist
Download
AI Customize

Add to Wishlist
Download
AI Customize


Add to Wishlist
Download
AI Customize

Add to Wishlist
Download
AI Customize

Add to Wishlist
Download
AI Customize

Add to Wishlist
Download
AI Customize

Add to Wishlist
Download
AI Customize

Add to Wishlist
Download
AI Customize

Add to Wishlist
Download
AI Customize

Add to Wishlist
Download
AI Customize

Add to Wishlist
Download
AI Customize

Add to Wishlist
Download
AI Customize

Add to Wishlist
Download
AI Customize

Add to Wishlist
Download
AI Customize


Add to Wishlist
Download
AI Customize

Free
Add to Wishlist
Download
AI Customize

Add to Wishlist
Download
AI Customize
