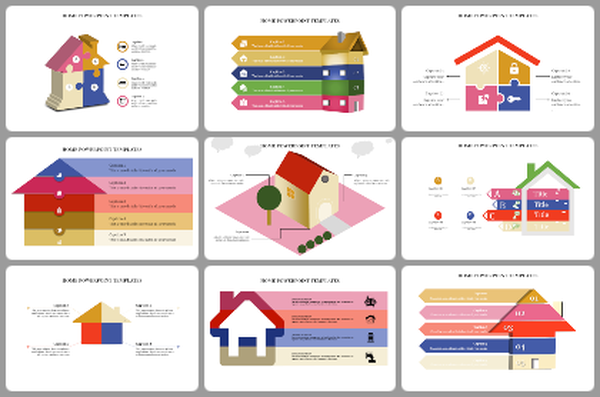
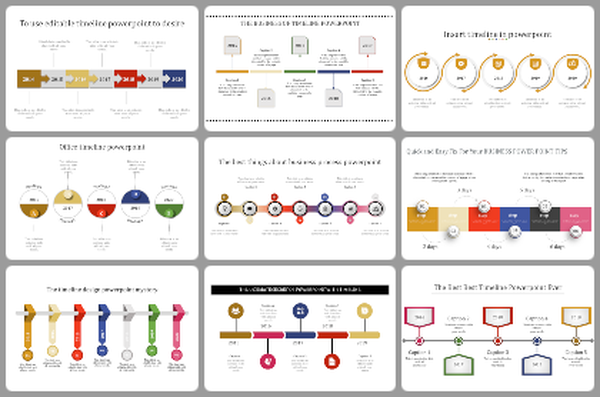
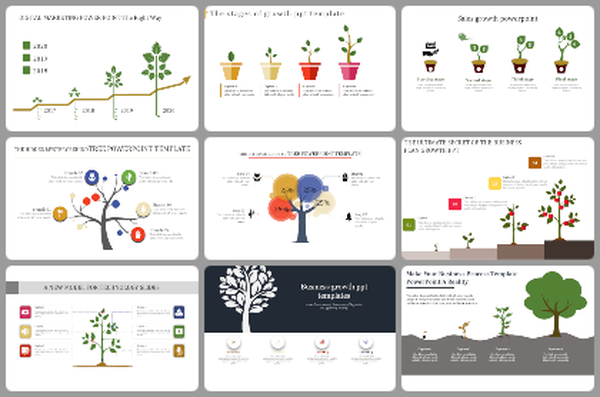
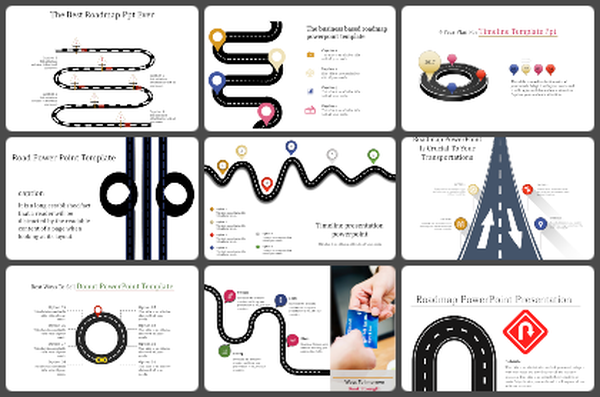
Best Collection Of Infographic PowerPoint Templates And Google Slides Themes
Customizable Infographic Presentation Template
Purpose of this slide:
To visually represent data or progress in an easily digestible format. It’s ideal for presenting statistical information, performance metrics, survey results, or any data where comparative percentages matter. Customizable colors, percentages, and descriptive text allow adaptation to specific needs.
Who can benefit?
Individuals or organizations giving presentations: Business professionals sharing quarterly results. Educators explaining student performance. Researchers displaying survey findings. Anyone seeking a clear, professional way to showcase quantitative data.
How can users benefit from this template?
Provides visual impact: Engages the audience and aids understanding. Customizable: Users can tailor it to their specific data.
Download our templates today and transform your data into compelling visuals that make a lasting impact.
Features of the template:
- Slides are available in 4:3 & 16:9
- Well-crafted template with instant download.
- Get slides that are 100% customizable and easy to download


