Flexible Infographic Template for PowerPoint Presentations


Infographic PowerPoint Template and Google Slides
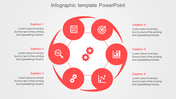
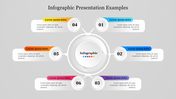
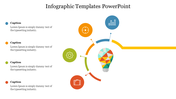
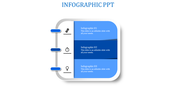
Introducing the Infographic PowerPoint Template and Google Slides – a dynamic tool designed to transform your data into visually engaging presentations. The image showcases a sleek 2x2 grid of circles, each featuring a different percentage and accompanying caption. With percentages ranging from 20% to 80%, this template offers a versatile platform for showcasing various data points and statistics.
This template is ideal for professionals across industries who need to present complex data clearly and compellingly. Whether you're delivering a sales report, outlining project milestones, or sharing research findings, this template enables you to communicate key insights effectively.
Available in "16:9" and "4:3" formats, as well as a zip file for convenient sharing and distribution. 100% customizable template, allowing you to personalize colors, fonts, and content to suit your specific needs. Download now and transform your data into impactful visuals that resonate with your audience!


You May Also Like These PowerPoint Templates
Add to Wishlist
Download
AI Customize

Add to Wishlist
Download
AI Customize

Add to Wishlist
Download
AI Customize

Add to Wishlist
Download
AI Customize

Free
Add to Wishlist
Download
AI Customize

Add to Wishlist
Download
AI Customize


Free
Add to Wishlist
Download
AI Customize

Add to Wishlist
Download
AI Customize

Add to Wishlist
Download
AI Customize

Add to Wishlist
Download
AI Customize

Add to Wishlist
Download
AI Customize

Add to Wishlist
Download
AI Customize

Add to Wishlist
Download
AI Customize

Add to Wishlist
Download
AI Customize

Add to Wishlist
Download
AI Customize

Add to Wishlist
Download
AI Customize

Add to Wishlist
Download
AI Customize
