Free - Infographic Chart PowerPoint Template for Insights
Free

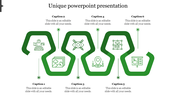
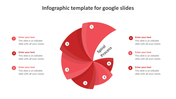
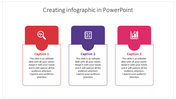
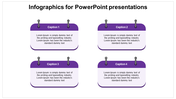

Infographics for PowerPoint Presentations
Infographics are pictorial representations of data that use text, images, and charts to quickly and simply express information. This free infographic is original and was made for a PowerPoint slide with five red circles. Five circles of varying sizes, each of which represents a percentage, are included in the template. The proportion is indicated by the text in each circle's center. This is an excellent template to use for presenting information on a company's performance, survey findings, or any other information you wish to display in an interesting way. The wording, percentages, and circle colors are all simply editable, and you can also include your own data.
Features of the template
- 100% customizable slides and easy to download.
- Slides are available in different colors
- The slide has 4:3 and 16:9 formats.
- Easy to change the slide colors quickly.
- Appealing Presentation to impress an audience.
- Create feature-rich slide presentations.
- An eye-pleasing color slide helps to give a catchy display.
- It is prone to PPT and Google Slides.


You May Also Like These PowerPoint Templates
Add to Wishlist
Download
AI Customize

Add to Wishlist
Download
AI Customize

Add to Wishlist
Download
AI Customize

Add to Wishlist
Download
AI Customize

Free
Add to Wishlist
Download
AI Customize

Add to Wishlist
Download
AI Customize


Add to Wishlist
Download
AI Customize


Add to Wishlist
Download
AI Customize

Add to Wishlist
Download
AI Customize


Add to Wishlist
Download
AI Customize

Add to Wishlist
Download
AI Customize

Add to Wishlist
Download
AI Customize

Add to Wishlist
Download
AI Customize

Add to Wishlist
Download
AI Customize

