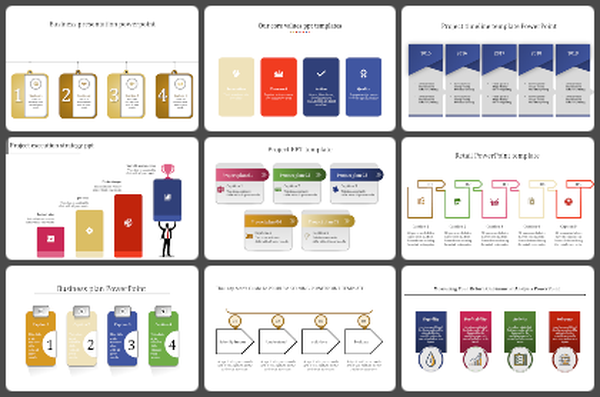
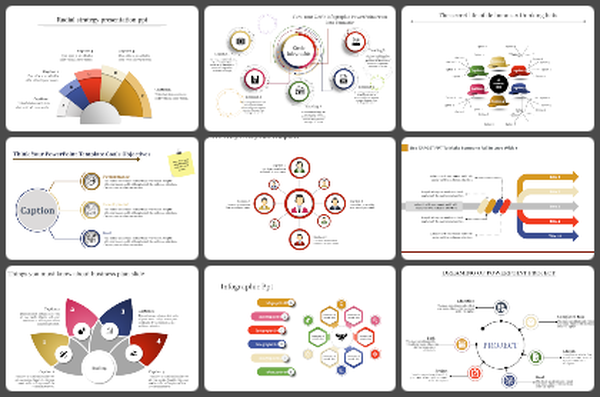
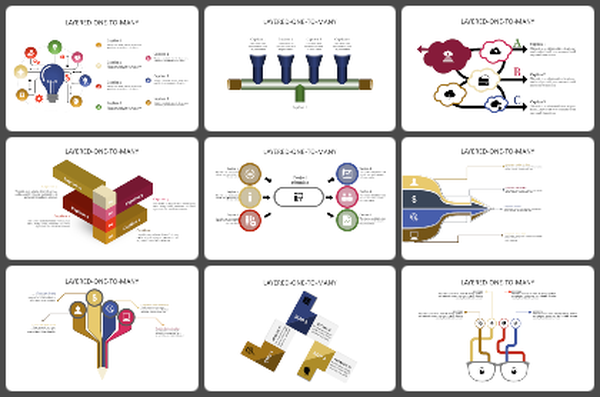
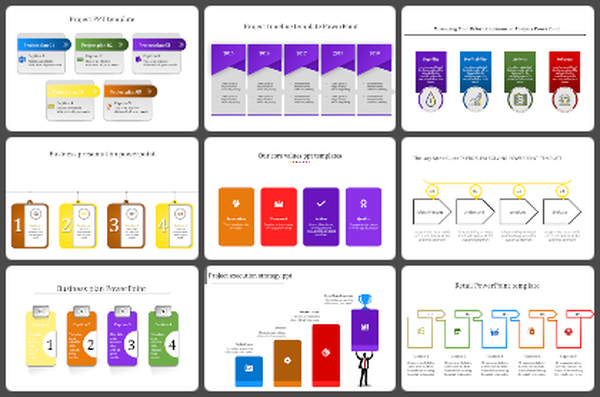
Multinoded Infographic Template PPT for Effective Visuals
Infographic PowerPoint Template and Google Slides Themes
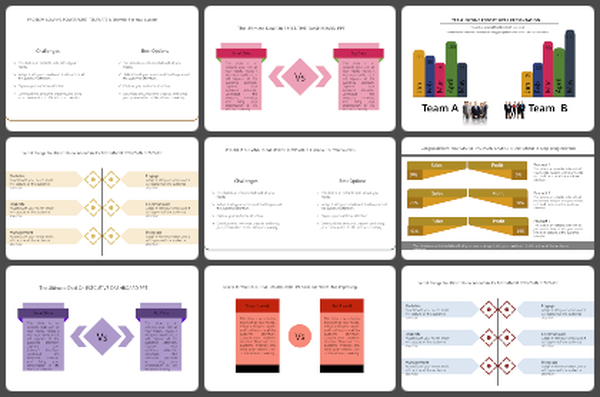
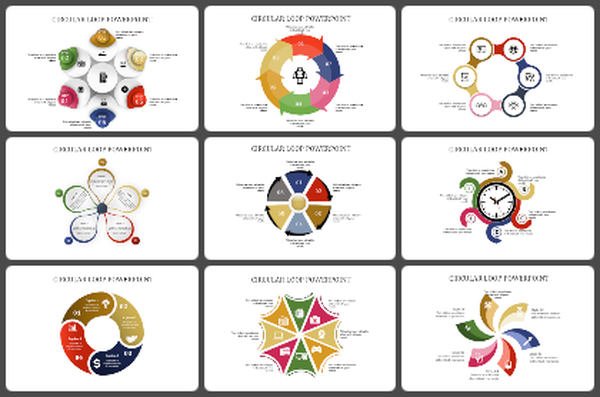
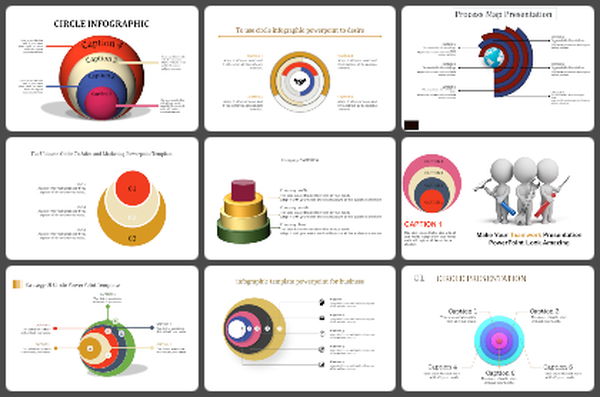
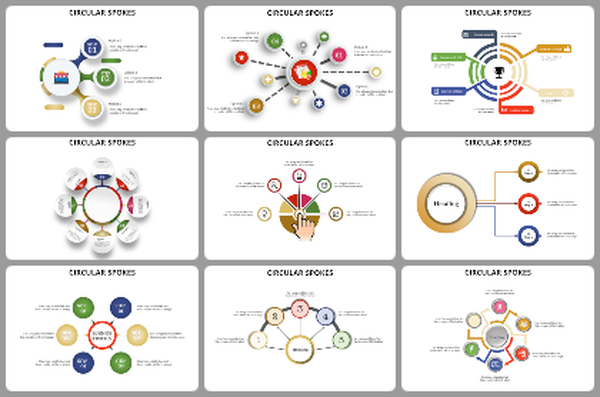
The infographic PowerPoint template and Google Slides theme showcase icon cubes ideal for financial presentations. Each cube represents a different aspect of finance or business, offering a visually engaging way to organize and present information.
With eight text areas corresponding to each logo, users can provide detailed descriptions, statistics, and key insights related to their financial data or business metrics. Additionally, the template allows for the integration of graphs, bar charts, and other visual elements to enhance the presentation of complex information.
This template is well-suited for financial analysts, business professionals, educators, and anyone seeking to convey financial concepts and data effectively. Its dynamic design and customizable features enable users to create visually compelling presentations that captivate audiences and facilitate understanding.
Whether delivering quarterly reports, investment proposals, or strategic analyses, this infographic PowerPoint template and Google Slides theme offer a versatile platform for communicating financial information with clarity and impact.
Features of the template
- 100% customizable slides and easy to download.
- Slides are available in different nodes & colors.
- The slide contains 16:9 and 4:3 formats.
- It is easy to change the colors of the slide quickly.
- Well-crafted template with an instant download facility.


