Inflation Vs Deflation PowerPoint And Google Slides
 Canva
Canva

Inflation Vs Deflation PPT, Google Slides, and Canva Template
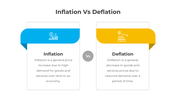
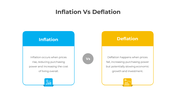
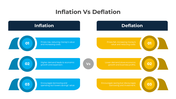
Inflation vs deflation are two key economic concepts that play a significant role in shaping the financial landscape of a country. Inflation is the rate at which the general level of prices for goods and services rises, eroding purchasing power. On the other hand, deflation is the decrease in the general price level, leading to an increase in purchasing power. Both phenomena have distinct impacts on the economy, businesses, and consumers, influencing decisions related to spending, saving, and investment.
Purpose Of The Slides
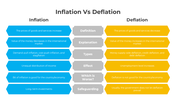
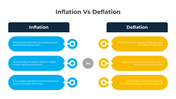
The Inflation vs Deflation slide deck is designed to provide an in-depth understanding of these critical economic forces. This comprehensive template offers a clear comparison between inflation and deflation, explaining their effects on prices, demand, interest rates, and economic stability. Ideal for educators, business professionals, and students, this deck is a valuable tool to present these concepts clearly and engagingly. The template includes sections on definitions, real-world examples, and visual aids to help users grasp the nuances of inflation and deflation.
Who Can Use It?
- Economists & Analysts: Essential for professionals in the economic and financial sectors who need to analyze and discuss inflation and deflation trends.
- Business Executives: Helpful for business leaders looking to understand how inflation and deflation affect market conditions and business strategy.
- Students & Educators: Perfect for economics students and teachers who need an informative resource for explaining these key concepts.
Special Key Features
This 11-slide presentation features a customizable design with infographics, graphs, and easy-to-understand visuals to compare and explain inflation and deflation.
Download the Inflation vs Deflation slide deck today to enhance your presentations with clear insights into these economic phenomena!
Features of this template
- 100% customizable slides and easy to download.
- The slides contain 16:9 and 4:3 formats.
- It is easy to change the colors quickly.
- Highly compatible with PowerPoint, Google Slides, and Canva templates.


You May Also Like These PowerPoint Templates
Add to Wishlist
Download
AI Customize

Add to Wishlist
Download
AI Customize

Add to Wishlist
Download
AI Customize

Add to Wishlist
Download
AI Customize


Add to Wishlist
Download
AI Customize


Free
Add to Wishlist
Download
AI Customize

Add to Wishlist
Download
AI Customize

Add to Wishlist
Download
AI Customize

Add to Wishlist
Download
AI Customize

Add to Wishlist
Download
AI Customize

Add to Wishlist
Download
AI Customize

Add to Wishlist
Download
AI Customize

Add to Wishlist
Download
AI Customize

Add to Wishlist
Download
AI Customize

Add to Wishlist
Download
AI Customize

Add to Wishlist
Download
AI Customize

Add to Wishlist
Download
AI Customize

Add to Wishlist
Download
AI Customize
