Creative Chart PowerPoint Templates with Two Nodes


Practical Chart PowerPoint Slide with Two Nodes
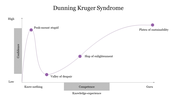
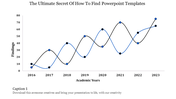
How to I find PowerPoint templates for the best charts? Check out our chart PowerPoint template. This slide features a crisp white background, creating a canvas for clarity. The chart, with its two lines, maps findings across academic years, offering a visual narrative that is both concise and impactful.
This slide is best for educators, researchers, and analysts. The x-axis denotes findings, while the y-axis unfolds across academic years, making it a versatile tool for presenting research trends and academic performance metrics.
Empower your presentations with a dynamic visualization of academic data, fostering engagement and understanding. The titleholder enhances the template's professionalism, making it suitable for educational institutions, research conferences, and analytical discussions.
Discover the ease of conveying complex data through our template. Elevate your academic presentations, guiding your audience through the analytical journey with precision and visual flair. Download now to unlock the potential of data-driven storytelling.
Features of the template
- 100% customizable slides are easy to download.
- Slides are available in different colors.
- The slide has 4:3 and 16:9 formats.
- It is easy to change the slide colors quickly.
- It has a cute design to impress an audience.
- Create feature-rich, animated presentations.


You May Also Like These PowerPoint Templates

Add to Wishlist
Download
AI Customize

Add to Wishlist
Download
AI Customize

Add to Wishlist
Download
AI Customize

Add to Wishlist
Download
AI Customize

Add to Wishlist
Download
AI Customize

Add to Wishlist
Download
AI Customize

Add to Wishlist
Download
AI Customize

Add to Wishlist
Download
AI Customize

Add to Wishlist
Download
AI Customize

Add to Wishlist
Download
AI Customize

Add to Wishlist
Download
AI Customize

Add to Wishlist
Download
AI Customize

Add to Wishlist
Download
AI Customize

Add to Wishlist
Download
AI Customize

Add to Wishlist
Download
AI Customize

Add to Wishlist
Download
AI Customize

Add to Wishlist
Download
AI Customize

Add to Wishlist
Download
AI Customize

Add to Wishlist
Download
AI Customize
