Graph PowerPoint Presentation Template


Graph PowerPoint Presentation Template
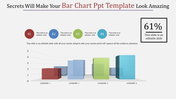
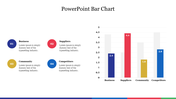
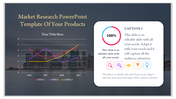
Dive into the world of data visualization with our Graph Presentation Template. A compelling bar graph takes center stage, vividly displaying the percentage distribution of students across different categories. Each bar represents a category, and the visual clarity ensures immediate comprehension.
This template is your go-to resource for any presentation where data-driven insights matter. Whether you're analyzing student demographics, presenting research findings, or showcasing business performance metrics, our Graph Presentation Template transforms raw data into a compelling visual narrative.
Available in "16:9" and "4:3" formats, ensuring flexibility in various presentation settings.
Packaged in zip format for convenient sharing and downloading. Download our template and let your numbers speak for themselves!


You May Also Like These PowerPoint Templates
Add to Wishlist
Download
AI Customize

Add to Wishlist
Download
AI Customize

Add to Wishlist
Download
AI Customize

Add to Wishlist
Download
AI Customize

Add to Wishlist
Download
AI Customize

Add to Wishlist
Download
AI Customize

Add to Wishlist
Download
AI Customize

Add to Wishlist
Download
AI Customize

Add to Wishlist
Download
AI Customize

Add to Wishlist
Download
AI Customize

Add to Wishlist
Download
AI Customize

Add to Wishlist
Download
AI Customize

Add to Wishlist
Download
AI Customize

Add to Wishlist
Download
AI Customize

Add to Wishlist
Download
AI Customize

Add to Wishlist
Download
AI Customize

Add to Wishlist
Download
AI Customize

Add to Wishlist
Download
AI Customize

Add to Wishlist
Download
AI Customize

Add to Wishlist
Download
AI Customize
