Free - Best Graph Free Template For PPT Presentation

Free
Four circular progress graphs in blue, orange, red, and green, each showing percentages and captions.
P.ID : 59853
    1.4K+ views
    713 Downloads
    Get Custom Slides by Experts
    Instantly Access Templates in PowerPoint

    Progressive Graph Free Template PowerPoint Presentation

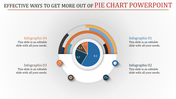
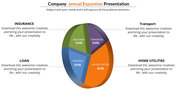
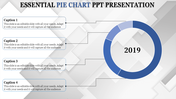
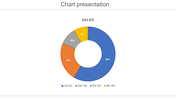
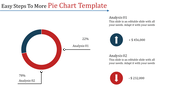
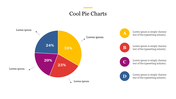
    Graphs are known for simplified data visualization and graphical representation of data. This Progressive Graph Free Template PowerPoint Presentation represents data in proportional circular rings. This pie chart representation is one of the popular graphical data representations. This template aids in indicating the business performance and management strategies.

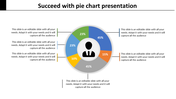
    This Progressive Graph Free Template PowerPoint Presentation is a four nodded template. Each node is represented by a proportional circular ring. They are represented with the icons of the graph, people, and money. The proportional shares are represented in percentage inside the circular rings. They are colored in blue, red, orange, and green. Each node has a separate caption and description area for a detailed explanation.

    This template is suitable for all kinds of proportional data representations. This is an easily editable template. It has an instant download feature. This ready-to-use template is a cost-free one.

    Features of this template:

    • 100% customizable slides and easy to download.
    • Slides available in different nodes & colors.
    • The slide contained 16:9 and 4:3 format.
    • Easy to change the slide colors quickly.
    • Well-crafted template with instant download facility.
    • Ready-to-use template with four nodded feature.
    • Suitable for proportional and analysis-based data representations.
    Advertisement

    You May Also Like These PowerPoint Templates

    Add to Wishlist
    Download
    AI Customize
    Pie Chart PPT Presentation Template for Data Analysis
    Free
    Add to Wishlist
    Download
    AI Customize
    Creative Pie Chart PowerPoint And Google Slides Template
    Free
    Add to Wishlist
    Download
    AI Customize
    Five Node New Business Presentation Template
    Add to Wishlist
    Download
    AI Customize
    Central 3D pie chart with eight colorful segments, each linked to numbered captions placed around it.
    Add to Wishlist
    Download
    AI Customize
    Colorful pie chart with six segments, each labeled with percentages and color-coded text on the right.
    Add to Wishlist
    Download
    AI Customize
    Multicolor Pie Chart PPT Template Presentation Designs
    Free
    Add to Wishlist
    Download
    AI Customize
    Best Business PowerPoint Slides for Professional Use
    Add to Wishlist
    Download
    AI Customize
    Multicolor Cycle Chart PowerPoint Slide Design
    Add to Wishlist
    Download
    AI Customize
    Circle Model Business Plan Template PowerPoint
    Add to Wishlist
    Download
    AI Customize
    Awesome Pie Chart Template Presentation Slide Design
    Add to Wishlist
    Download
    AI Customize
    Editable Finance PowerPoint Template & Google Slides
    Free
    Add to Wishlist
    Download
    AI Customize
    Engaging Pie Chart Template for Presentation - Cloud Model
    Add to Wishlist
    Download
    AI Customize
    Innovative Circle PowerPoint Template for Clear Visuals
    Free
    Add to Wishlist
    Download
    AI Customize
    Business Strategy Template PowerPoint and Google Slides
    Add to Wishlist
    Download
    AI Customize
    Progress chart slide showing four colorful circular charts labeled from business to report with varying percentages and text.
    Free
    Add to Wishlist
    Download
    AI Customize
    Multi-color pie chart slide deck showing data segments in various shades, each section labelled for visual comparison.
    Add to Wishlist
    Download
    AI Customize
    A color-coded pie chart illustrating four data segments with values 15%, 20%, 30%, and 35%, paired with text captions.
    Add to Wishlist
    Download
    AI Customize
    SmartArt pie chart showing 65% in red and 35% in green as a and b, with placeholder captions and a text box.