Awesome Gap Analysis Presentation Template Design


Amazing Gap Analysis Presentation Slide
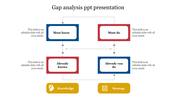
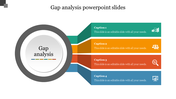
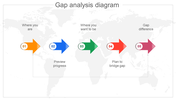
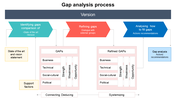
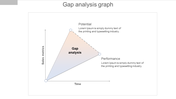
Gap Analysis PowerPoint slide information is typically compiled from a variety of sources, including market research, staff surveys, consumer feedback, and financial data. The information can be presented in a variety of ways, such as pie charts, bar graphs, or line graphs, and can be either qualitative or quantitative. Use this vibrant layout and circular design to draw viewers in and promote repeat visits. Use this fantastic background to add more eye-catching graphics, videos, and images. No matter how you present, you can add your points to the first half of the template. Make your audience feel involved in your presentation.
Features of the template
- 100 % customizable slides and easy to download.
- Slides are available in different colors
- The slide has 4:3 and 16:9 formats.
- Easy to change the slide colors quickly.
- Appealing presentation to impress an audience.
- Create feature-rich slide presentations.
- An eye-pleasing color slide helps to give a catchy presentation.
- The slide is compatible with Google slides.
- Unique gap analysis design.


You May Also Like These PowerPoint Templates
Add to Wishlist
Download
AI Customize

Add to Wishlist
Download
AI Customize

Add to Wishlist
Download
AI Customize

Add to Wishlist
Download
AI Customize

Add to Wishlist
Download
AI Customize

Add to Wishlist
Download
AI Customize

Add to Wishlist
Download
AI Customize

Add to Wishlist
Download
AI Customize

Add to Wishlist
Download
AI Customize

Add to Wishlist
Download
AI Customize

Add to Wishlist
Download
AI Customize

Add to Wishlist
Download
AI Customize

Add to Wishlist
Download
AI Customize

Add to Wishlist
Download
AI Customize

Add to Wishlist
Download
AI Customize

Add to Wishlist
Download
AI Customize

Add to Wishlist
Download
AI Customize

Add to Wishlist
Download
AI Customize

Add to Wishlist
Download
AI Customize

Add to Wishlist
Download
AI Customize
