Gantt Chart PowerPoint Template and Google Slides
1.3K+
views
155
Downloads
Get Custom Slides by Experts
Enhance Your Presentations with Add-ins
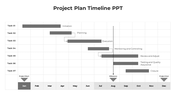
Gantt Chart PowerPoint Template and Google Slides
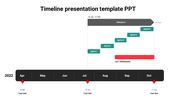
The "Gantt Chart PowerPoint Template and Google Slides" is a valuable tool for visualizing project schedules and timelines. It features a Gantt chart, a type of bar chart that displays project tasks over time. Each task is represented by a colored bar, with the length of the bar indicating the duration of the task. The chart is divided into weeks, providing a clear overview of the project timeline and task dependencies.
This template is ideal for project managers, team leaders, and business professionals involved in planning and tracking project progress. It can be used during project kick-off meetings, progress updates, and presentations to stakeholders to communicate project timelines effectively and identify potential scheduling conflicts.
Compatibility with PowerPoint and Google Slides. Available in both 16:9 and 4:3 aspect ratios, catering to different screen sizes and presentation preferences. Provided in ZIP format for easy sharing and distribution. Free template with 100% customizable features. Download now.
You May Also Like These PowerPoint Templates