Get Gantt Chart PowerPoint Template Slides Designs

Gantt chart PowerPoint template showing a timeline for multiple targets across January, February, and March, with milestones.
P.ID : 3320
    785 views
    37 Downloads
    Get Custom Slides by Experts
    Instantly Access Templates in PowerPoint

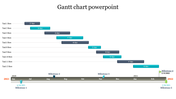
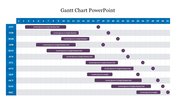
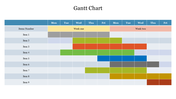
    Interesting Gantt Chart PPT Template


    The Gantt chart template is solely used for the graphical representation of project data. The Gantt chart shows the elements, resources, and planning methods. The bar graph design the different shades of colors. The colors on the chart can make the data differentiated and easier to understand. The nodes make the presentation improvised with the details of the Gantt model with customizable features. Try out the best and bring out the best effect. Improve your graphical presentation with this unique presentation. 

    Features of the Template:

    • 100% customizable slides and easy to download.
    • The slide contains 16:9 and 4:3 formats. 
    • Slides are available in different nodes & colors.
    • Easy to change the colors of the slide quickly.
    • Well-crafted template with an instant download facility.
    Advertisement

    You May Also Like These PowerPoint Templates

    Add to Wishlist
    Download
    AI Customize
    Comprehensive KPI dashboard slide with performance indicators visualized through charts and graphs for business tracking.
    Free
    Add to Wishlist
    Download
    AI Customize
    KPI dashboard slide showcasing various business metrics through colorful bar charts, pie charts, and a gauge meter.
    Add to Wishlist
    Download
    AI Customize
    Editable KPI Format PowerPoint And Google Slides Template
    Add to Wishlist
    Download
    AI Customize
    Smart chart template slide showing bar and line charts labeled net profit alongside numbered caption area.
    Add to Wishlist
    Download
    AI Customize
    Best Gantt Chart Template PowerPoint and Google Slide
    Add to Wishlist
    Download
    AI Customize
    A bubble chart slide with four quadrants featuring colorful icons for key business strategies with a placeholder text area.
    Add to Wishlist
    Download
    AI Customize
    SmartArt pie chart showing 65% in red and 35% in green as a and b, with placeholder captions and a text box.
    Add to Wishlist
    Download
    AI Customize
    Radar PowerPoint Presentation Templates and Google Slides
    Add to Wishlist
    Download
    AI Customize
    Pentagon-shaped spider chart displaying two datasets in red and blue with two numbered caption areas.
    Add to Wishlist
    Download
    AI Customize
    Slide featuring a blue umbrella graphic with three labeled sections and two text boxes on the right.
    Free
    Add to Wishlist
    Download
    AI Customize
    Four vertical bar charts in orange, blue, red, and green on a white background, each with captions below.
    Add to Wishlist
    Download
    AI Customize
    Colorful pie chart with four segments in blue, purple, red, and orange, with matching text boxes showing percentages.
    Add to Wishlist
    Download
    AI Customize
    Multicolor Online Marketing Dashboard Template With Graph
    Add to Wishlist
    Download
    AI Customize
    Metrics Dashboard PowerPoint Template & Google Slides
    Add to Wishlist
    Download
    AI Customize
    Editable Cockpit Charts PowerPoint Slide Template Design
    Add to Wishlist
    Download
    AI Customize
    Blank chart slide with a weekly layout from monday to sunday, featuring a grid for scheduling or organizing tasks.
    Free
    Add to Wishlist
    Download
    AI Customize
    Cute PowerPoint Radar Chart Templates For Presentation
    Add to Wishlist
    Download
    AI Customize
    Yearly Gantt Chart Template Design For Presentation