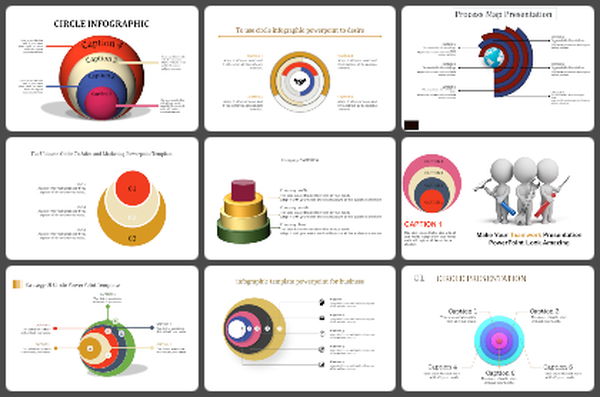
Free - Free Venn Diagram Template Keynote Slide Design
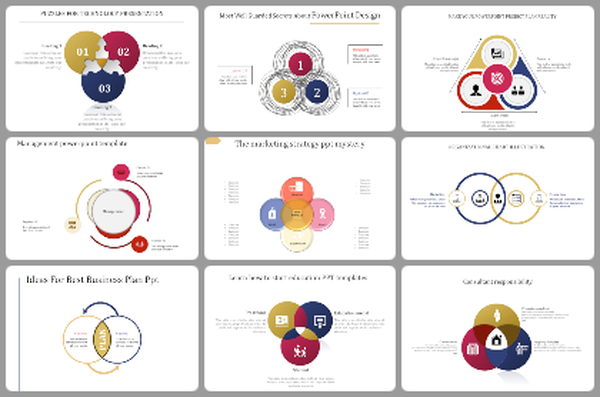
Venn Diagram Presentation Slide
A Venn diagram is a graphical representation of the relationships among a set of items, typically shown as overlapping circles. Each circle represents a set, and the overlapping region shows the items that are shared between them. Venn diagrams are widely used in fields such as mathematics, logic, statistics, and computer science to illustrate concepts such as set theory, probability, and data analysis. They are also useful in business, education, and other areas to visually represent complex information in a clear and concise way. By using our template, you can convey your message in a clear and concise manner.
Features of the template
- 100 % customizable template and easy to download.
- Template are available in different nodes & colors.
- The template is contained in 16:9 and 4:3 format.
- Easy to change the template colors quickly.
- Highly compatible with PowerPoint and google slides.
- Show relationships with clarity using our Venn Diagram template!


