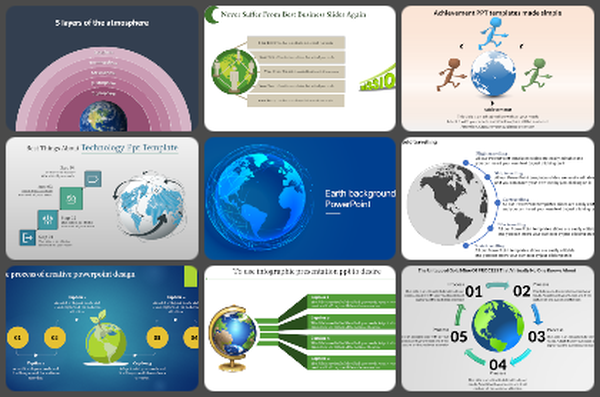
Free - Our Topnotch Free Globe PPT Template For Presentation
Free

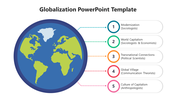

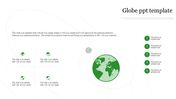


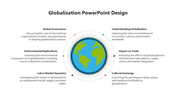


Three Noded Globe Theme PowerPoint Template
The bar chart is a method of summarizing a set of categorical data. It displays data using several bars, each representing a particular category. Create bar chart-themed presentations with our Globe with Bar Chart Template. It is built with a creative bar chart containing six bars, which will help you to include business, statistical, marketing and finance data. The three nodes represent years. In addition, you can alter the color and design of the bar chart graphics. Download this template to craft an interesting presentation.
Features of the template
- 100% customizable slides and easy to download.
- Slides are available in different nodes & colors.
- The slide contained 16:9 and 4:3 formats.
- Easy to change the slide colors quickly.
- Well-crafted template with instant download facility.
- 3D bar chart designs inserted.
- Spacious text area with three nodes.
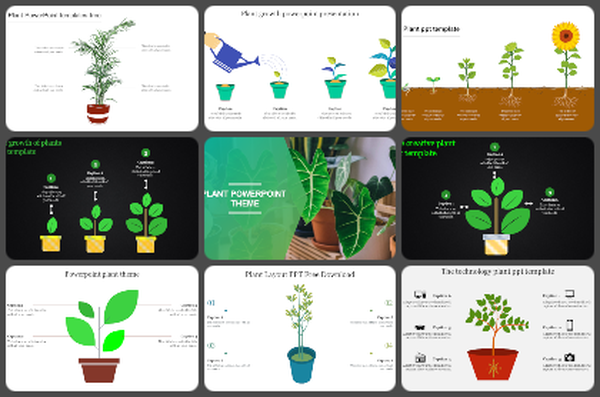
You May Also Like These PowerPoint Templates
Add to Wishlist
Download
AI Customize

Add to Wishlist
Download
AI Customize

Add to Wishlist
Download
AI Customize

Add to Wishlist
Download
AI Customize


Add to Wishlist
Download
AI Customize

Add to Wishlist
Download
AI Customize


Add to Wishlist
Download
AI Customize

Add to Wishlist
Download
AI Customize

Add to Wishlist
Download
AI Customize

Add to Wishlist
Download
AI Customize

Add to Wishlist
Download
AI Customize

Add to Wishlist
Download
AI Customize

Add to Wishlist
Download
AI Customize

Add to Wishlist
Download
AI Customize

Add to Wishlist
Download
AI Customize

Add to Wishlist
Download
AI Customize

Add to Wishlist
Download
AI Customize
