Free - Get This Chart Infographics PowerPoint And Google Slides
Free

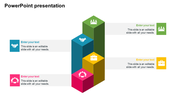
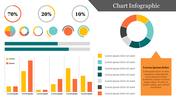
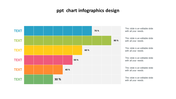
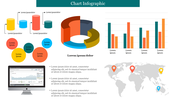
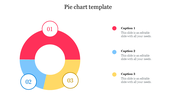
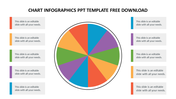
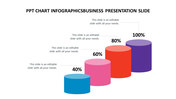
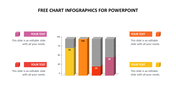

Imaginative Chart Infographics PowerPoint Template
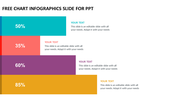
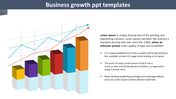
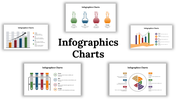
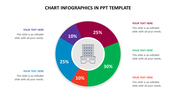
A chart is a powerful tool for visualizing data, helping the interpretation of trends, patterns and relationships for better understanding and analysis. It simplifies complex information into easy-to-interpret visuals, such as bar charts, line charts, and pie charts, each serving a unique purpose in effectively presenting data. By compressing data into graphical forms, charts facilitate communication, improve understanding, and support data-driven decision-making processes in various fields and industries. They are essential in presentations, reports and analyses, providing a clear and concise overview of data to inform and influence decision makers. Professionals in business, finance, marketing, education, and research can use this template to create impactful presentations, using its customizable chart templates to visualize data and effectively convey insights. With fully editable slides, users can customize chart styles, colors and labels to suit their specific data visualization needs, ensuring maximum impact and clarity while saving time in creating professional presentations. Adapt this template to enhance presentations and bring data to life with compelling visuals.
Features of this template
- 100% customizable slides and easy to download.
- The slide contains 16:9 and 4:3 formats.
- Easy to change the colors of the slide quickly.
- Highly compatible with PowerPoint and Google Slides.
- Well-crafted template with an instant download facility.
- Quick and easy edit features.


You May Also Like These PowerPoint Templates
Add to Wishlist
Download
AI Customize


Add to Wishlist
Download
AI Customize

Add to Wishlist
Download
AI Customize


Add to Wishlist
Download
AI Customize

Free
Add to Wishlist
Download
AI Customize

Add to Wishlist
Download
AI Customize

Add to Wishlist
Download
AI Customize

Add to Wishlist
Download
AI Customize

Add to Wishlist
Download
AI Customize

Add to Wishlist
Download
AI Customize

Add to Wishlist
Download
AI Customize

Add to Wishlist
Download
AI Customize

Add to Wishlist
Download
AI Customize


Add to Wishlist
Download
AI Customize

Add to Wishlist
Download
AI Customize

Add to Wishlist
Download
AI Customize

Add to Wishlist
Download
AI Customize
