Free - Best Break Even PowerPoint Slide With Editable Graph

Free
Best Break Even PowerPoint Slide With Editable Graph
P.ID : 50057
    866 views
    186 Downloads
    Get Custom Slides by Experts
    Instantly Access Templates in PowerPoint

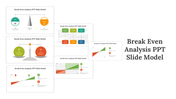
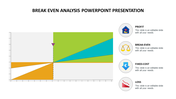
    Free Break Even Analysis Slide With Graph 

    Break-even analysis refers to the point where total cost and revenue are equal. SlideEgg offers this free break even PowerPoint slide to present this economic tool to decide a company's cost structure. This pre-designed slide comes with an editable graph. It is a five-noded slide with bright-colored rectangles to present the break-even, sales, units, loss, and profit. It is easy to use and 100% editable according to your needs. Rush to grab!

    Features of the template

    • 100% customizable slides and easy to download.
    • Slides are available in different nodes & colors.
    • The slide contains 16:9 and 4:3 formats.
    • Easy to change the colors of the slide quickly.
    • Well-crafted template with instant download facility.
    • Free slide with premium quality.
    Advertisement

    You May Also Like These PowerPoint Templates

    Add to Wishlist
    Download
    AI Customize
    A colorful break even point chart slide highlighting six key financial statuses from reduced costs to high profit with text.
    Add to Wishlist
    Download
    AI Customize
    Break even analysis slide with a colorful semicircular gauge and text sections on both sides.
    Add to Wishlist
    Download
    AI Customize
    Balance scale graphic with red and green percentage indicators, showing loss on the left and profit on the right.
    Add to Wishlist
    Download
    AI Customize
    Break even analysis PowerPoint template diagrams
    Free
    Add to Wishlist
    Download
    AI Customize
    Horizontal line with five circular icons in red, pink, purple, blue, and yellow, representing different financial stages.
    Free
    Add to Wishlist
    Download
    AI Customize
    Best Break Even PowerPoint Slide With Editable Graph
    Add to Wishlist
    Download
    AI Customize
    Diagram illustrating a break-even point analysis with profit and loss regions meeting at a central break-even marker.
    Free
    Add to Wishlist
    Download
    AI Customize
    Slide featuring a break-even point chart in orange, red, and purple sections, with text areas on the left and right.
    Add to Wishlist
    Download
    AI Customize
    Break even analysis slide with stacked bars in green, orange, red, and yellow, surrounded by cost and revenue icons.
    Add to Wishlist
    Download
    AI Customize
    Break-even analysis graphic showing a green scale balancing two large colored circles.
    Free
    Add to Wishlist
    Download
    AI Customize
    Customized Break Even Analysis PPT Free Download Slide
    Add to Wishlist
    Download
    AI Customize
    Semi circle gauge with five color coded segments from green to gray, and a central black pointer showing financial range.
    Add to Wishlist
    Download
    AI Customize
    Break even analysis slide with three charts representing different stages with placeholder text.
    Add to Wishlist
    Download
    AI Customize
    Break even analysis powerpoint presentation design