Multicolor Five Circle Venn Diagram PowerPoint Slide

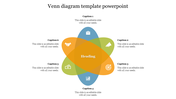
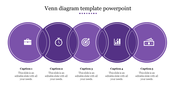
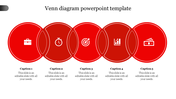

Five Circle Venn Diagram Presentation Slide
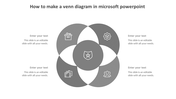
A five-circle Venn diagram is a visual representation of the relationships between five different sets or groups of data. It consists of five overlapping circles that create a total of 31 possible intersections or regions. The diagram can be used to compare and contrast data from different sources, identify commonalities and differences, and analyze complex relationships between multiple variables. It is a useful tool in fields such as statistics, data analysis, and market research. With our slides, you can create a high-quality presentation that will leave a lasting impression on your audience about five-circle Venn diagram.
Features of the template:
- 100% customizable slide and easy to download.
- The slide contained 16:9 and 4:3 format.
- Well-crafted template with an instant download facility.
- Highly compatible with PowerPoint and Google Slides.
- This slide has a colorful design pattern.
- Easy to change the slide colors.


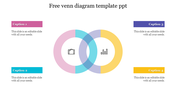
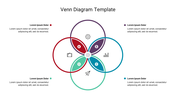
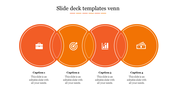
You May Also Like These PowerPoint Templates

Add to Wishlist
Download
AI Customize

Add to Wishlist
Download
AI Customize

Add to Wishlist
Download
AI Customize

Add to Wishlist
Download
AI Customize

Free
Add to Wishlist
Download
AI Customize

Add to Wishlist
Download
AI Customize

Add to Wishlist
Download
AI Customize

Add to Wishlist
Download
AI Customize


Add to Wishlist
Download
AI Customize


Add to Wishlist
Download
AI Customize

Add to Wishlist
Download
AI Customize

Add to Wishlist
Download
AI Customize


Add to Wishlist
Download
AI Customize
