Financial Analysis PPT Template & Google Slides Presentation

Split slide with a blue title section on the left and a table comparing financial ratios over three years on the right.
P.ID : 32052
    2.3K+ views
    240 Downloads
    Get Custom Slides by Experts
    Instantly Access Templates in PowerPoint

    Financial Ratio Analysis Presentation Slide

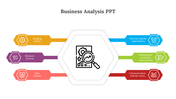
    "Understanding the language of finance is essential for every business!" Financial ratio analysis helps businesses to better understand their finances and assess their performance. It provides financial insights into the profitability and liquidity of a company and helps in making informed decisions. Our template is the perfect tool to present this key financial metric in a visually appealing way. It has comprehensive data-driven slide designs that can be easily customized to meet your unique needs.

    Features of the template.

    • 100% customizable slides and easy-to-download
    • Slides are available in different nodes & colors.
    • The slides contain 16:9 and 4:3 formats.
    • Easy to change the slide colors quickly.
    • It is a well-crafted template with an instant download facility.
    • We designed this slide with a stunning design.
    • You can use this in Microsoft PowerPoint.
    Advertisement

    You May Also Like These PowerPoint Templates

    Add to Wishlist
    Download
    AI Customize
    Situation analysis slide featuring a central magnifying glass over a circular diagram with four colorful segments around it.
    Add to Wishlist
    Download
    AI Customize
    Research paper slide with six key sections from introduction to further recommendation with icons and text.
    Add to Wishlist
    Download
    AI Customize
    Diagram for SOAR analysis divided into four quadrants with central focus and supporting textual details.
    Add to Wishlist
    Download
    AI Customize
    Stakeholder analysis with rows of blue and gray icons representing different levels of engagement.
    Add to Wishlist
    Download
    AI Customize
    Analysis slide with five colored bars in green, red, yellow, navy, and blue, each with hexagonal icons and numbered circles.
    Add to Wishlist
    Download
    AI Customize
    A slide showing a situation analysis template with four colorful sections with placeholder text.
    Add to Wishlist
    Download
    AI Customize
    Competitive analysis slides featuring various comparison tables and rating charts for evaluating competitors.
    Add to Wishlist
    Download
    AI Customize
    Slide featuring three overlapping circles in blue, red, and green with key points, alongside a yellow topped text box.
    Add to Wishlist
    Download
    AI Customize
    Five numbered hexagons in red, orange, green, teal, and blue, each with text inside.
    Add to Wishlist
    Download
    AI Customize
    Slide deck showcasing cost effectiveness analysis with a triangular infographic and colorful supporting charts.
    Add to Wishlist
    Download
    AI Customize
    A colorful business forecasting slide featuring a puzzle like layout that outlines key advantages.
    Add to Wishlist
    Download
    AI Customize
    Market analysis template with seven numbered steps arranged around a central magnifying glass icon over a pink background.
    Add to Wishlist
    Download
    AI Customize
    A business analytics PowerPoint slide with icons surrounding a magnifying glass and a book with captions on a dark theme.
    Add to Wishlist
    Download
    AI Customize
    Growth analysis PowerPoint template with four steps and a computer showing bar chart analysis.
    Add to Wishlist
    Download
    AI Customize
    Root cause analysis slide with a tree diagram and four labeled colored boxes on branches, with three captions at the bottom.
    Add to Wishlist
    Download
    AI Customize
    Circular infographic with a central globe icon connected to eight color-coded nodes for analytics techniques.
    Free
    Add to Wishlist
    Download
    AI Customize
    Colorful radial design with six segments around a red analysis icon, highlighting key analytics strategies.