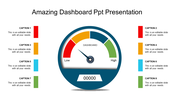
Amazing Executive Dashboard PPT With Arrow Diagram

Executive dashboard slide featuring a horizontal flow of four numbered gold arrows with titles and placeholder text.
P.ID : 3997
    233 views
    16 Downloads
    Get Custom Slides by Experts
    Instantly Access Templates in PowerPoint

    Executive Dashboard Templates and Google Slides

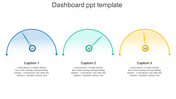
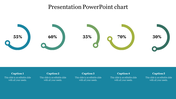
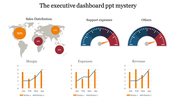
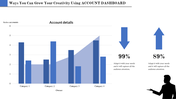
    The Executive Dashboard PowerPoint is a pivotal tool in business presentations, seamlessly integrating the power of information visualization with a sleek design. Crafted with an arrow design and featuring four nodes, this executive dashboard slide deck exemplifies professionalism with its sophisticated shades of colors. Ideal for dashboard designing presentations, it offers a comprehensive snapshot of key metrics, enabling executives to make informed decisions swiftly. The strategic layout enhances data interpretation, providing clarity on intricate business aspects. Elevate your presentation game with the Executive Dashboard Slide Deck, a dynamic asset tailored for impactful business presentations.

    Feature of the template

    • 100% customizable slides and easy to download.
    • Slides available in different nodes & colors.
    • The slide is contained in 16:9 and 4:3 format.
    • Easy to change the slide colors quickly.
    • Well-crafted template with instant download facility. 
    Advertisement

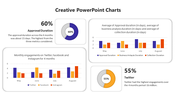
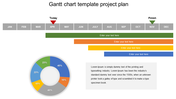
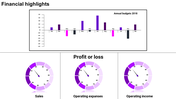
    You May Also Like These PowerPoint Templates

    Add to Wishlist
    Download
    AI Customize
    KPI dashboard with a dual-line graph, balance performance gauge, and quarterly income metrics.
    Free
    Add to Wishlist
    Download
    AI Customize
    Project dashboard with a table containing rows for tasks, dates, and signature for author, client, and manager approval.
    Add to Wishlist
    Download
    AI Customize
    Project schedule slide with a Gantt chart displaying tasks, timelines, and completion percentages.
    Free
    Add to Wishlist
    Download
    AI Customize
    Dashboard with line graphs, a circular chart with three segments, and labeled financial metrics, in red, orange, and green.
    Add to Wishlist
    Download
    AI Customize
    Dashboard slide showing Zantedeschia, Celosia, and Calendula growth data with a bar chart from 2012 to 2017.
    Add to Wishlist
    Download
    AI Customize
    Business dashboard with progress indicators for promotion, channel management, and revenue metrics.
    Add to Wishlist
    Download
    AI Customize
    A dashboard style slide showing plant growth data for Zantedeschia, Celosia, and Calendula with gauge charts and a bar graph.
    Free
    Add to Wishlist
    Download
    AI Customize
    Comparison of revenue and cost distributions with pie charts displaying CAPEX and OPEX percentages.
    Free
    Add to Wishlist
    Download
    AI Customize
    Horizontal Gantt chart showing tasks by days with segments in blue, purple, and black, indicating task progress and status.
    Add to Wishlist
    Download
    AI Customize
    Funnel infographic with blue, red, yellow, and green sections, each with icons, connected to text descriptions.
    Free
    Add to Wishlist
    Download
    AI Customize
    Four vertical orange columns and percentages, labeled by year, along with a businesswoman illustration on the right.
    Add to Wishlist
    Download
    AI Customize
    Botanical data dashboard template  showing performance metrics for flower species, featuring line and bar charts.
    Free
    Add to Wishlist
    Download
    AI Customize
    Colorful dashboard style meters PPT slide with captions and placeholder text.
    Free
    Add to Wishlist
    Download
    AI Customize
    Dashboard layout featuring a line graph, pie chart, net worth value, and categorized assets and liabilities in green theme.
    Add to Wishlist
    Download
    AI Customize
    PowerPoint slide with multiple chart types, including bar, line, and pie charts with different styles.
    Free
    Add to Wishlist
    Download
    AI Customize
    Executive dashboard slide featuring different vehicles like bike, car, container, train, and plane with title sections.
    Free
    Add to Wishlist
    Download
    AI Customize
    Chart with colorful bars representing yearly data from 2013 to 2020, paired with eight colorful cube icons on the sides.
    Add to Wishlist
    Download
    AI Customize
    Gantt chart PPT slide displaying tasks with start and end dates, milestones, and progress tracking for each month.
    Add to Wishlist
    Download
    AI Customize
    KPI dashboard featuring a funnel chart, audience metrics, bar graph, and a circular chart with 2021 data.
    Free
    Add to Wishlist
    Download
    AI Customize
    Free KPI PPT Template For Presentation & Google Slides