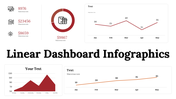
Free - Best Growth Model Executive Dashboard PPT Template

Free
Five-level bar chart executive dashboard with colored blocks labeled with five levels, showing a gradual progression.
P.ID : 3944
    632 views
    174 Downloads
    Get Custom Slides by Experts
    Instantly Access Templates in PowerPoint

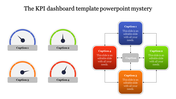
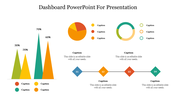
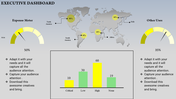
    Executive Dashboard PowerPoint Template: Five Nodes 


    Are you ready to transform your business insights into a compelling visual narrative? Get our growth model executive dashboard PPT template, a game-changer for executives, analysts, and decision-makers who want to present business growth.

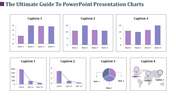
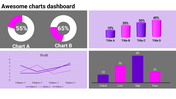
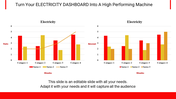
    This template features an impactful graph with five bars, each uniquely colored to highlight key metrics. It has five text areas, it simplifies the process of communicating complex data points. Ideal for CEOs, business strategists, and project managers, this template enables you to present growth models with clarity and precision.

    Are you ready to elevate your dashboard presentations? Click now to access the growth model dashboard PPT, where visual representation meets strategic clarity. Propel your growth narratives, engage your stakeholders, and showcase your business. Your journey to impactful executive dashboards starts here!

    Features of the template


    • 100% customizable slides are easy to download.
    • Slides are available in different colors.
    • The slide has 4:3 and 16:9 formats.
    • It is easy to change the slide colors quickly.
    • It has a cute design to impress an audience.
    • Create feature-rich, animated presentations.
    Advertisement

    You May Also Like These PowerPoint Templates

    Add to Wishlist
    Download
    AI Customize
    KPI Dashboard PowerPoint And Google Slides Template
    Add to Wishlist
    Download
    AI Customize
    Creative Dashboard PowerPoint And Google Slides Template
    Add to Wishlist
    Download
    AI Customize
    Download KPI Slide Template Presentation
    Add to Wishlist
    Download
    AI Customize
    Easy To Editable KPI Dashboard PowerPoint Template
    Free
    Add to Wishlist
    Download
    AI Customize
    Dashboard with four sections showing charts, icons, and metrics in purple, red, green, and teal.
    Free
    Add to Wishlist
    Download
    AI Customize
    Incrediable Dashboard PowerPoint Presentation Slide
    Free
    Add to Wishlist
    Download
    AI Customize
    Informative KPI Dashboard Template Download Slide PPT
    Add to Wishlist
    Download
    AI Customize
    KPI dashboard slide displaying supplier metrics with colorful pie charts, bar graphs, and a process flow with percentages.
    Free
    Add to Wishlist
    Download
    AI Customize
    Get Simple & Effective Project Dashboard PPT Presentation
    Free
    Add to Wishlist
    Download
    AI Customize
    KPI Presentation PowerPoint for Template Google Slides
    Free
    Add to Wishlist
    Download
    AI Customize
    KPI Dashboard Template PPT Presentation and Google Slides
    Free
    Add to Wishlist
    Download
    AI Customize
    Slide with multiple dashboard elements including bar charts, line charts, pie charts, and progress meters in various colors.
    Free
    Add to Wishlist
    Download
    AI Customize
    KPI PowerPoint slide with line, bar, pie, and horizontal bar charts, each showing different business data metrics.
    Free
    Add to Wishlist
    Download
    AI Customize
    Free Dashboard Templates For PowerPoint & Google Slides
    Add to Wishlist
    Download
    AI Customize
    Dashboard slide displaying data through colorful bar charts, a pie chart, and a project timeline with phase completions.
    Free
    Add to Wishlist
    Download
    AI Customize
    Semi circular speedometer graphic with red to yellow gradient, and three placeholder text below.
    Add to Wishlist
    Download
    AI Customize
    RAG status slide with a task table featuring colored status indicators and four charts, including pie and line graphs.
    Add to Wishlist
    Download
    AI Customize
    Comprehensive KPI dashboard slide with performance indicators visualized through charts and graphs for business tracking.
    Free
    Add to Wishlist
    Download
    AI Customize
    KPI dashboard slide showcasing various business metrics through colorful bar charts, pie charts, and a gauge meter.